


Are you ready to take your project planning to the next level? In this guide, we’ll dive into the details of how to use Microsoft Project to create dynamic and insightful Gantt charts and why they are helpful in keeping your project on track and driving your team to success from project kickoff to launch.
KEY TAKEAWAYS
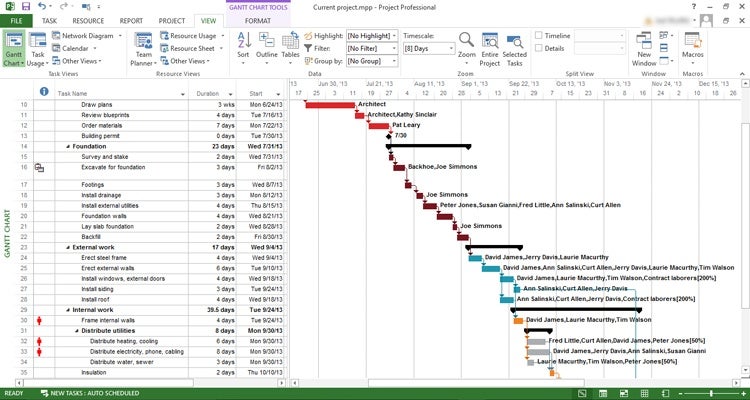
One of the most useful tools in the project management arsenal is the Gantt chart, which is an easier and more convenient way of looking at tasks scheduled over a timeline. Gantt charts simplify the complex web of tasks, deadlines, and resources, allowing you to showcase a well-orchestrated project with confidence.
9 Steps to Creating a Microsoft Project Gantt Chart
Microsoft Project is one of the most well-known Gantt chart software tools. Follow this easy Microsoft Project tutorial if you want to learn how to make a Gantt chart in the platform.
Read our complete Microsoft Project software review.
1. Launch Microsoft Project
- Open the program on your computer to get started creating your Gantt chart.
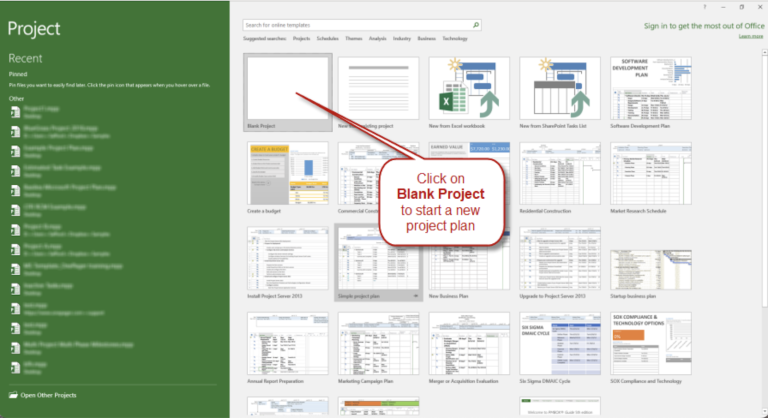
2. Start a new project
- Create a new project by selecting File then New then Blank Project.
- A new project template resembles a chart that looks like a spreadsheet.
- Give your new project a name and choose a start date.
- Save the new project.
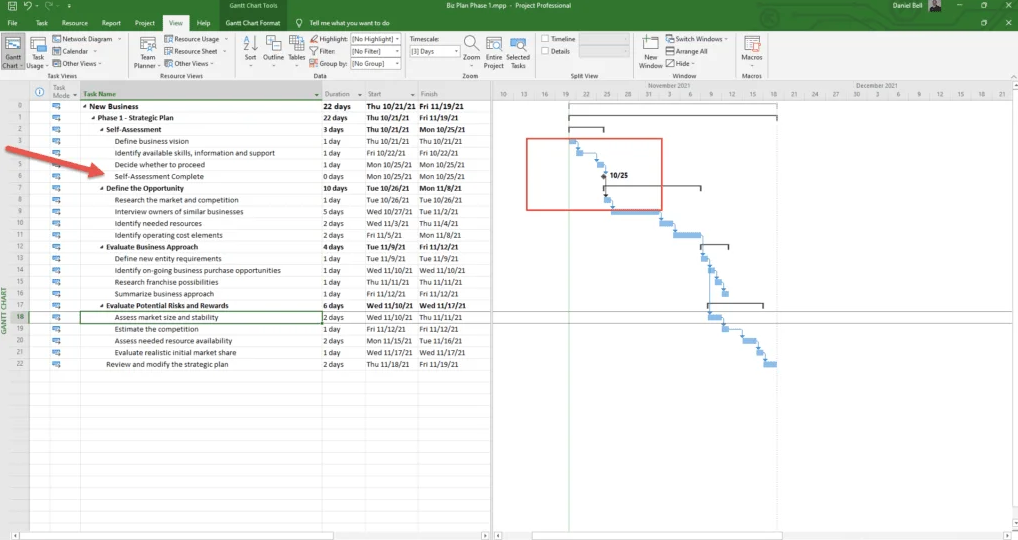
3. List project tasks, subtasks, and milestones
- Begin entering tasks in the Task Name column, listing all work steps that need to be completed that you know of.
- Note milestones by setting the duration of a task to 0 days to convert it into a milestone with a symbol to represent key events or to mark important stages of the project.
- If you have related tasks, you can group them as subtasks by indenting them under a main task (group).
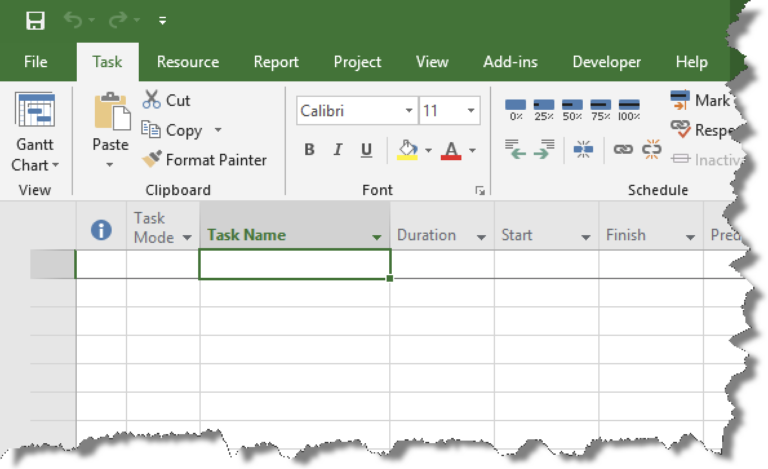
4. Enter task information
- Enter information in the Task Name column of the Gantt chart view about each task, including their duration, start date, and dependencies.
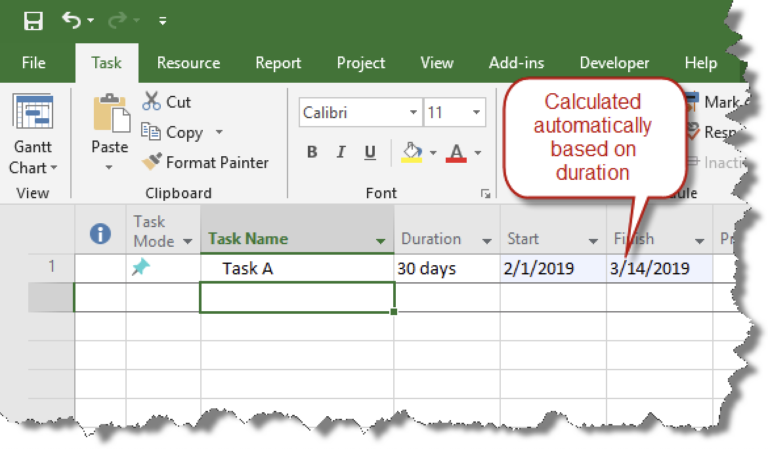
5. Adjust task duration and dates
- Review each task and fine-tune the duration and beginning and end dates to reflect the actual time needed.
- These values can be adjusted directly in the Gantt chart view or by editing each task separately.
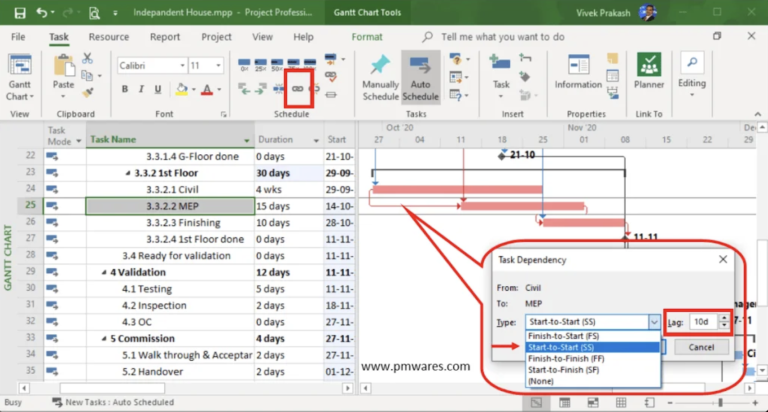
6. Set dependencies
- Establish task dependencies by linking tasks together, showing what has to happen first and then what follows in what order.
- Set a dependency by selecting a task, clicking on the Predecessors column, and enter the number of the task ID of the preceding task(s).
- There are four types of dependencies in MS Project:
- Finish to Start – used when two tasks are in a sequence and one depends upon finish of the other task
- Start to Start – used when two tasks are to be executed in parallel but one task cannot start until the other task is started
- Finish to Finish – used when two tasks are to be executed in parallel but one task cannot finish until the other is finished
- Start to Finish – used seldom when work cannot be left unattended and must be picked up by another as in shift duties
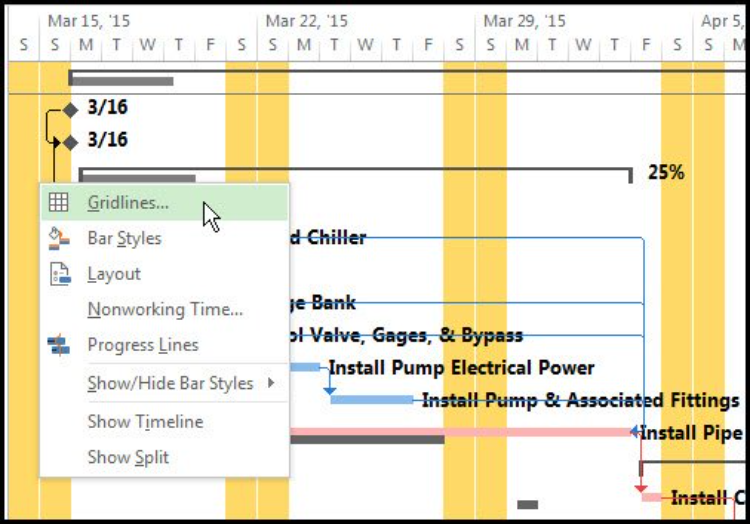
7. Format the Gantt chart
- Customize the appearance of your new Gantt chart so it is easier to understand at a glance.
- Right-click on the Gantt chart to see a selection of custom options to choose from.
- Visual settings include assigning colors, fonts, and gridlines to make things easier to see.
8. Review and save the project
- Make sure to save the project every time you make any edits.
- You can choose to save the project locally on your computer or to the cloud for easy access from anywhere.
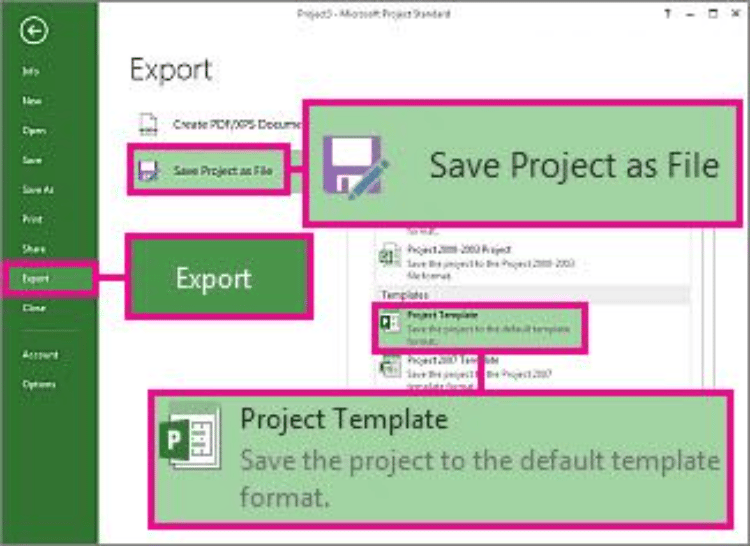
9. Share your Gantt chart
- Don’t forget to share your new Gantt chart with team members, clients, vendors, or project stakeholders to keep them informed about the project, progress, and changes.
- Choose specific settings on who can access the chart and what they can do with it.
- Export the Gantt chart to a variety of file formats to include screenshots in presentations, meeting notes, or to send via email.
Free Gantt Chart Template with Samples
If you are interested in seeing how a Gantt chart works and trying it out to see if it is something you want to use for your project, you are in luck! Here are some free Gantt chart templates along with samples you can explore to find the best fit for your work and team:
1. TemplateLab offers a variety of Gantt chart templates in Excel, Word, and PowerPoint formats. Try them out for free to visualize project timelines, milestones, and task dependencies.
Visit TemplateLab2. Office Timeline provides free Gantt chart templates that you can experiment with and modify to make your own representations of timelines, deadlines, and critical paths.
Visit Office Timeline3. Microsoft Create also offers customizable Gantt chart templates so you can quickly build your project details and schedule into a visual format to share with your team.
Visit Microsoft Create4. Smartsheet has free Gantt chart templates with sample data that you can download off their site and customize to suit your project needs.
5. Google Sheets even offers several free Gantt chart templates accessible from the Google Sheets template gallery.
Visit Google Sheets6. Several Gantt chart software options are also available from providers like Instagantt and GanttPRO.
Visit Instagantt Visit GanttPRO7 Ways You Can Use Gantt Charts to Boost Project Performance
Gantt charts are an invaluable project management tool. There are many ways you can maximize a Gantt chart’s data visualization capabilities for your next project. Here are seven of them.
- Visualize project plans: A Gantt chart will guide you through the chaos of tasks, deadlines, and dependencies. Get clarity at a glance when planning new work.
- Identify task dependencies and priorities: A Gantt chart can reveal the handoffs between tasks, showing exactly what needs to happen before the next steps can occur.
- Allocate resources effectively: Choreograph resource allocation as priorities shift, reassigning who is responsible for the work so things keep moving and resources stay tasked and not over busy.
- Manage deadlines and changes: Peek into the future to see when tasks should be finished and when deadlines need to be met so you can keep close track of progress and adjust as needed to keep the goal a reality.
- Communicate and report on project plans: Provide visual evidence and support to team members, executives, and stakeholders in an easy format to quickly grasp the details of the project’s status.
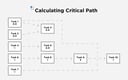
- Forecast project completion: This will help you see the critical path of work, which is the shortest route from start to finish.
- Facilitate decision-making: Fuel informed choices by allowing stakeholders to see the work on the task, resource, and dependency levels so they can consult with clarity and direct decisions intelligently.
Who Should Use a Gantt Chart?
While project managers are the primary audience for Gantt charts, these tools can be used by anyone leading a team or managing work, no matter the industry:
- Team leaders and supervisors – with a need to visualize project timelines, resource availability, and track work progress.
- Scheduling and traffic managers – with a need to schedule tasks, manage dependencies, and optimize resources.
- Executives and stakeholders – who want to see a high-level overview of project milestones to make informed decisions.
- Content creators and writers – who need assistance with planning content, and setting deadlines for drafts, revisions, and publishing timeframes.
- Event planners and coordinators – who utilize charts to manage event logistics, plan activities, and allocate staff and vendors for a well-coordinated event.
- General and operations managers – who want to oversee multiple projects and prioritize work.
- Marketing teams – who require aid in campaign planning, content creation, and social media scheduling so that all efforts align with the business.
- Researchers and academics – with a need for a tool to help in planning research phases, data collection, analysis, and publication deadlines.
- Remote teams – who can benefit from a visual roadmap, making it easier to collaborate and see progress across different time zones.
- Construction managers and architects – for managing construction projects, allocating resources, tracking work, and coordinating subcontractors.
- Government contractors – for help managing complex contacts, ensuring compliance, meeting deadlines, and delivering quality results.
- Educators and students – for support organizing study schedules, coursework deadlines, and planning research projects and dissertations.
Bottom Line: Gantt Chart as a Visual Project Management Tool
Gantt charts are visual project management tools that display tasks and timelines, help project managers manage resources, and interconnect dependencies. They are useful because they provide a clear view of project schedules, tasks, and milestones, while providing project managers with an easy way to allocate resources and reveal task interdependencies and critical paths. It is easy to create your own Gantt chart using a variety of free tools. If your organization requires a more robust project management option, Microsoft Project is a top choice to help transform a chaotic list of tasks into a visual plan to get the work done on any project.