


Key takeaways
In project management, Gantt charts are one of the most effective tools to map out tasks and deadlines in a single view, and I have relied on them throughout my years of managing projects.
A quick look at the timeline helps me spot conflicts or bottlenecks before they turn into larger issues. In this article, I walk through everything you need to know about Gantt charts and how to get the most out of them in your projects.
What is a Gantt chart?
In project management, a Gantt chart is a diagram that combines nested lists, bar charts, and timelines to visually represent a project’s order and timing.
A list of activities appears on the left of the document. An interval timeline, usually in days or weeks, appears on top and spans the rest of the document to the right of the vertical activity list. A horizontal task bar appears opposite an activity or task, with its length displaying duration.

With a Gantt chart, it is easy for project managers to view the sequence of tasks — which tasks will be completed first and which ones will end later, as well as critical task dependencies, task duration, and overall project duration. In comparison to a bar chart, a Gantt chart offers much more rich and actionable data.
Gantt charts are also an effective tool for tracking project milestones — these are events within the project timeline that indicate significant progress toward completion. Tracking these milestones allows project managers to determine how fast or slow the project is progressing.
Users can create Gantt charts from scratch. Alternatively, there are templates available in Gantt chart software solutions, and Gantt chart tools are also commonly included in general project management software.
READ MORE: Top Gantt Chart Makers
Named after American engineer and management consultant Henry Gantt, the traditional Gantt chart was developed in the early 1900s and was drawn by hand. Today, teams use modern Gantt charts to manage and monitor projects. Here, we’ll cover what a Gantt chart is, what its main uses are, its limitations, as well as the two main benefits to project management — along with a visual example. For all intents and purposes, when we refer to a Gantt chart, the modern is implied.
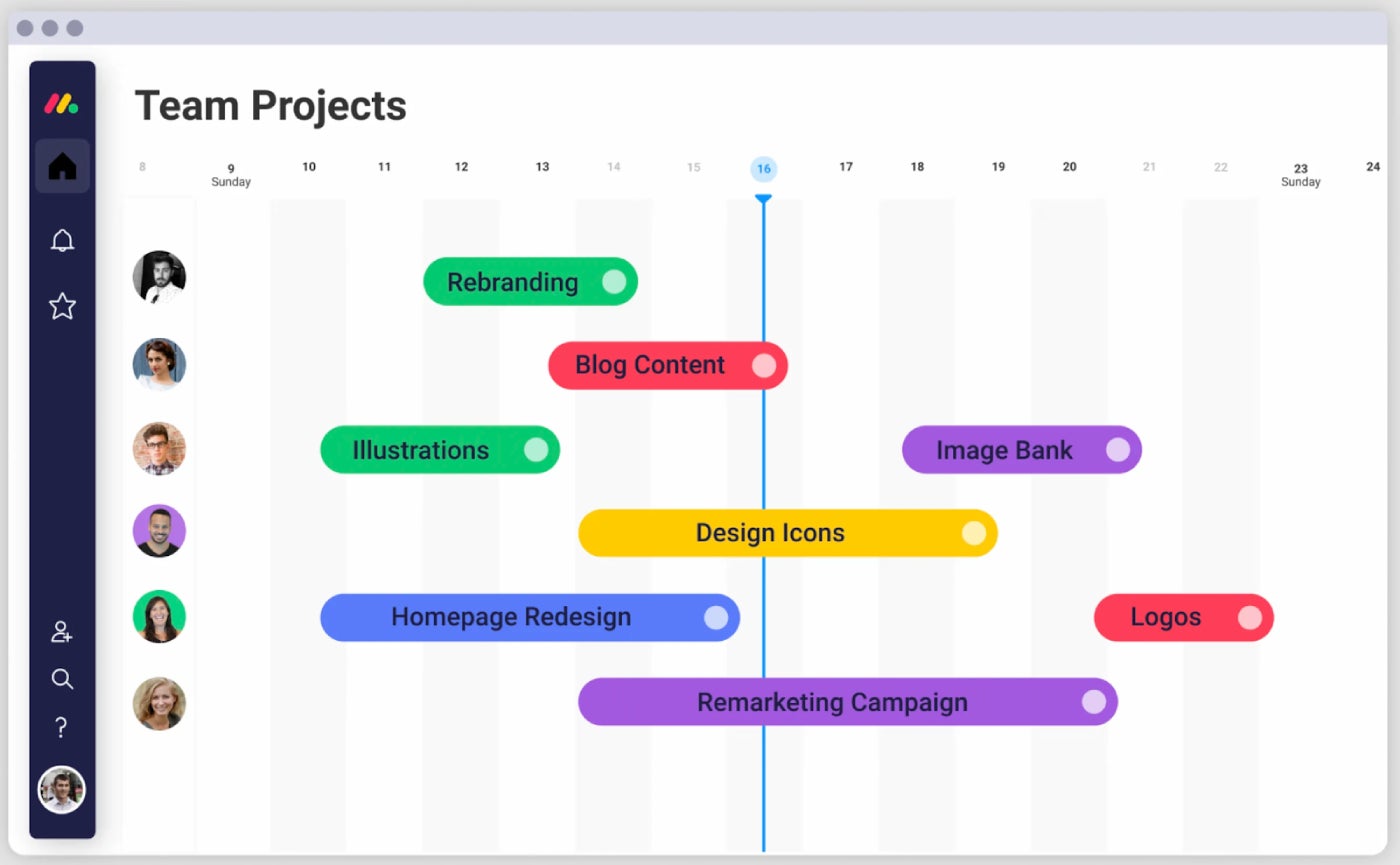
monday.com’s Gantt chart displays the full project schedule as a horizontal bar chart, with each bar representing a task plotted against a timeline. Dependencies between items are shown using arrow lines, and a baseline feature captures a snapshot of the original plan so I can compare it against actual progress. I can switch the timeline between day, week, month, or quarter views, and any changes made in other board views reflect in the Gantt automatically.
Visit monday.comKey features of a Gantt chart
A Gantt chart comes with a set of features that give project managers better control over scheduling, task relationships, and progress tracking. Here are the key features that make Gantt charts effective:
- Task bars: Each task is represented as a horizontal bar plotted against a timeline, showing its start date, end date, and duration at a glance.
- Dependencies: Arrow lines connect related tasks to show which ones must be completed before others can begin, helping teams avoid scheduling conflicts.
- Milestones: Key dates or deliverables are marked as fixed points on the timeline, which serves as a reference for measuring project progress.
- Baseline: A snapshot of the original project plan is locked into the chart so managers can compare it against actual progress and identify where the project has deviated.
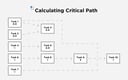
- Critical path: The sequence of tasks that determines the project’s completion date is highlighted, making it easier to prioritize work that cannot be delayed.
- Resource assignment: Team members can be assigned to tasks within the chart.
- Progress tracking: Each task bar reflects the percentage of work completed, which represents the project status against the planned schedule.
How to create a Gantt chart
Whether you want to build one from scratch or customize a template, learning how to create a Gantt chart is a skill that pays off across every type of project. Here is a step-by-step breakdown of the process:
- Define your project scope: Before building the chart, list out all the work that needs to be done and establish the project’s start and end dates. This gives the Gantt chart its boundaries.
- Break the project into tasks: Divide the project into individual tasks or phases. Each one should be specific enough to assign, schedule, and track independently.
- Set task durations: Assign a start date and end date to each task based on time estimates. Make sure to take note of task dependencies and available resources.
- Identify dependencies: Determine which tasks rely on the completion of others and link them accordingly so the chart reflects the actual sequence of work.
- Assign resources: Attach team members or roles to each task so everyone knows their responsibilities and workload distribution.
- Set milestones: Mark important dates or deliverables on the timeline to signal checkpoints for measuring progress throughout the project.
- Establish a baseline: Once the plan is finalized, lock in a baseline snapshot of the schedule so you have a reference point to compare against as the project moves forward.
- Track and update progress: As work gets underway, update task completion percentages and adjust dates when needed to keep the chart accurate and the team informed.
What are Gantt charts used for?
Below are a few of the main ways that Gantt charts are employed.
Project scheduling
Gantt charts can display more than just project status. They can also deliver detailed project timelines according to projected tasks and their deadlines. They can also provide a bird’s-eye view of information, such as summary tasks and overall project progress, or a worm’s-eye view, which looks at more specific task progress and who is responsible for it.
Gantt charts display the relationship of tasks over time and the project sequence, task dependencies, critical path, and milestones. It is a vital project plan that keeps teams organized and on the same page.
Project stage overview
Gantt charts can cover the entire project life cycle but allow you to hone in on divisions, phases, or parts of a project. With a Gantt chart, users can easily expand or collapse sections of a project or zoom in on a small project that’s part of a bigger whole, giving them insight into the work breakdown structure (WBS) of the project.
Project progress
Gantt charts allow teams to easily update task status and completion. This capability makes project management easier because it automatically updates individual tasks and progress elements of the chart across user accounts/screens, displaying the most current task status for all involved.
READ MORE: Best Gantt Chart Software for Project Management
Benefits of Gantt charts
Easier project planning
As you ramp up a project, a Gantt chart simplifies the planning process in several ways, including but not limited to:
- Prioritizing and sequencing tasks
- Breaking down large tasks into more manageable subtasks
- Linking dependent tasks
- Identifying the critical path and project milestones
- Determining the longest sequence of tasks and their duration
Better alignment across the team
Gantt charts provide all team members with access to the same data through a comprehensive and easy-to-digest diagram. When everyone on the team has easy access to relevant project information, there’s better communication and collaboration.
Limitations of Gantt charts
Teams use Gantt charts mainly for project schedule management. They do not include all project information in the chart because doing so is counterintuitive, defeating the chart’s main purpose. Some information is, therefore, necessarily absent from a typical Gantt-based project plan.
Other limitations include:
- Managing and updating the chart itself, especially when it’s made from scratch
- Project scope creep
- Limited task visibility
- No display of budget/cost details
- Bar length in a horizontal bar chart indicates time duration but not actual progress (or actual hours of work)
- Difficult to get a general project overview
- Difficult to print out and/or present to others
Bottom line: Why use a Gantt chart?
While Gantt charts certainly do not replace project managers, they do make their job’s easier, allowing them to work and generate project plans more efficiently. They are also more streamlined and easily parsable than something like a PERT chart. Gantt charts facilitate project team collaboration and communication by laying out a project plan.
Gantt chart software is, therefore, an especially good investment for organizations that execute complex, time-sensitive projects.
READ NEXT: Advantages and Disadvantages of Gantt Charts