


The last part of the tutorial is finally up. In this part of the tutorial, we are going to see the most important reports available for us and how to use the user interface for our favor. Most reports can be used often for checking the progress of your projects.
All tutorial parts:
- ProjectLibre tutorial Part 1: Creating your first project
- ProjectLibre tutorial Part 2: Task Breakdown, Resources
- ProjectLibre tutorial Part 3: Assigning resources, calculating costs
- ProjectLibre tutorial Part 4: Project Baseline, Calendar
- ProjectLibre tutorial Part 5: Reports
Quick Reminder About Resources
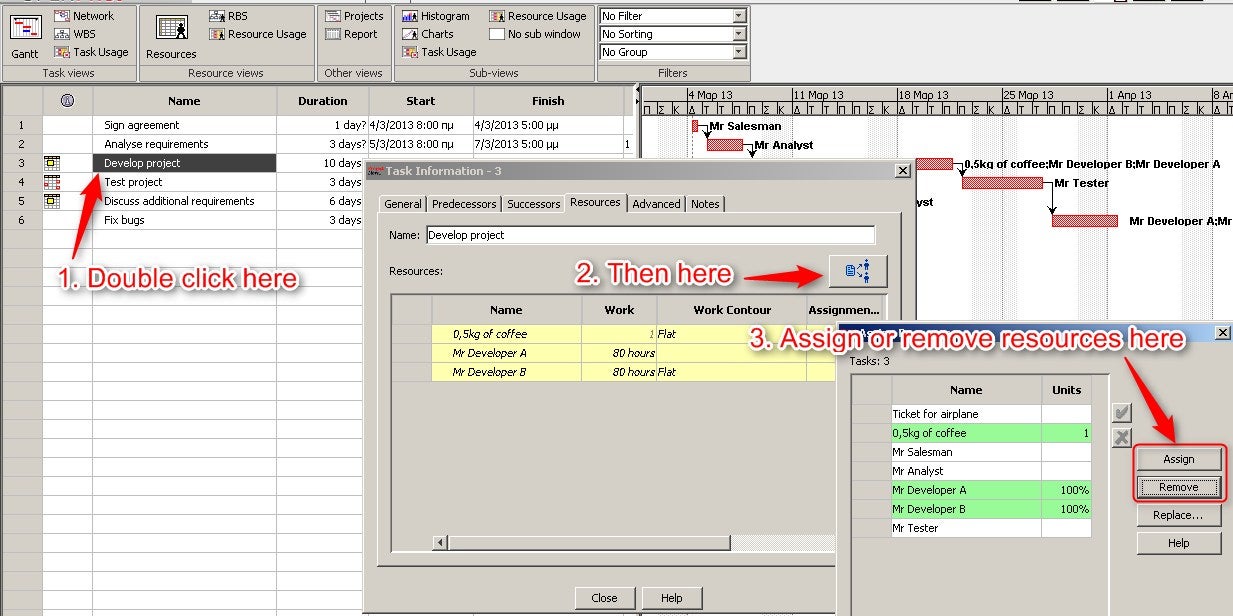
Since we are probably going to use data related to Gantt diagrams and resources. In order to remove a resource from a task, you cannot do it from the resource view. You must double click on the task, click on the resources tab, click on the icon for resources assignment and assign or remove resources as you wish.
Ok, enough for the reviews for now. Let’s start with the reports. There are four reports available in ProjectLibre:
- Project Details
- Resource Information
- Task Information
- Who Does What
Each of the reports, except “Project Details ” have various versions available:
Resource Information
- Default
- Earned Value
- Earned Value Cost
- Earned Value Schedule
- Name
Task Information
- Baseline
- Constraint Dates
- Cost
- Default
- Earned Value
- Earned Value Cost
- Earned Value Schedule
- Name
- Schedule
- Schedule (CPM)
- Schedule Variance
- Summary
- Tracking
- Work
Who Does What
- Assigned Resources
- Basic Report
- Name and Id
- Resource Usage
- Tasks Assigned
The reports that are highlighted are the ones that we are going to describe later.
Project details report
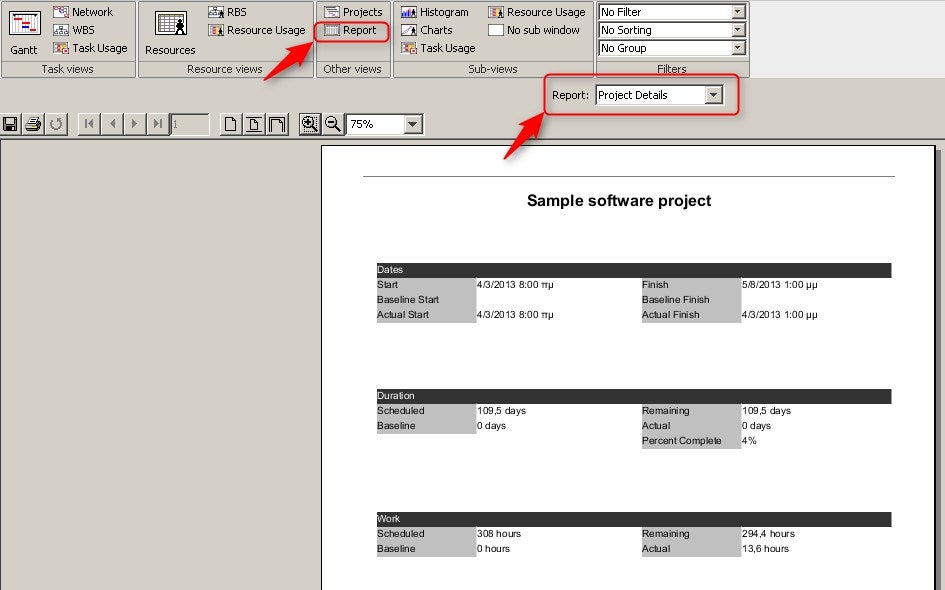
The project details report, displays the following information:
Dates: Start, Finish, Actual Start and Actual Finish
Duration: Scheduled, Remaining, Actual and Percent Complete
Work: Scheduled, Remaining and Actual
Costs: Scheduled, Remaining, Actual and Variance
Along with notes.
In order to view the report click on View, then ‘Report’ and then Report: Project Details’
Some notes about ProjectLibre reports
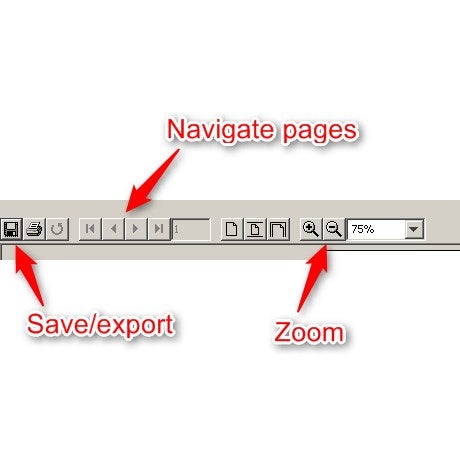
While the functions of the reports are limited, and at some reports, some filtering and sorting options might not work. You can always click on the little disk icon and export the report at an Excel file and do whatever you like with that. Also, you can zoom in, zoom out and move pages with the toolbar options.
Resource Information – Default
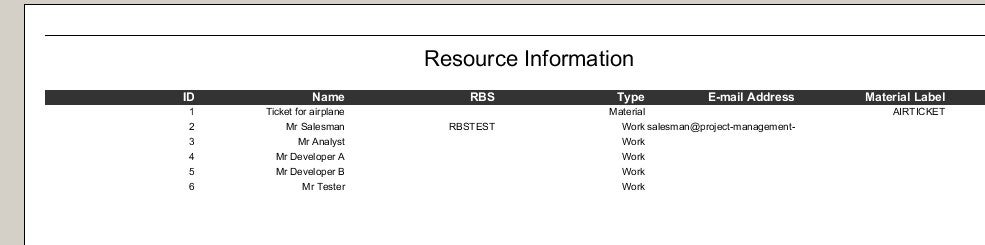
The Resource Information – Default report displays in a simple list all your resources with the following columns:
Name, RBS, Type, E-mail Address, Material Label
Resource Information—Earned Value
The Resource Information—Earned Value report, displays your resources along with various columns related to Earned Value (BCWS, BCWP, ACWP, CV, SV, EAC…)
Task Information
—
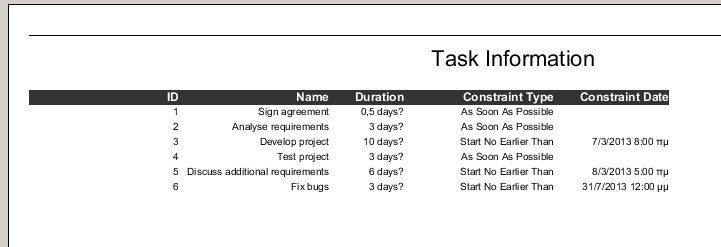
Constraint Dates
The Task Information — Constraint Dates report is very useful to check all the constraint dates at once as a checklist. You can use this report as a checklist regularly to check that everything is going according to plan.
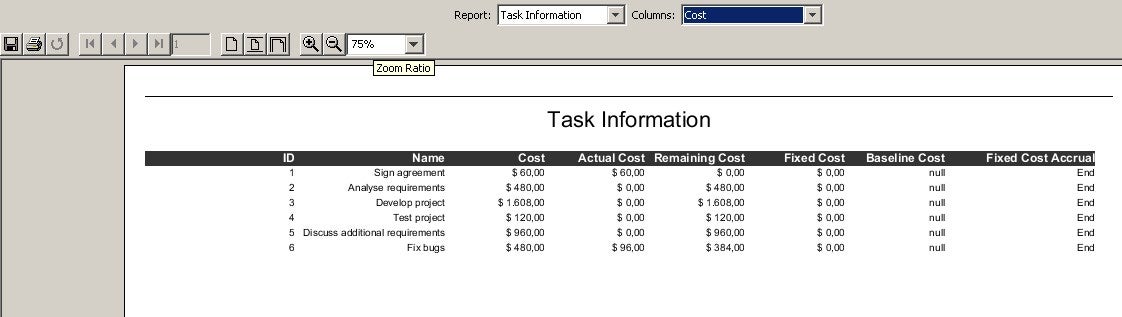
Task Information — Cost
The Task Information — Cost report might be one of your favorites. At this report, you can have a quick glance at every task cost, actual cost and remaining cost. It might be a useful report to export at Excel for extra filtering.
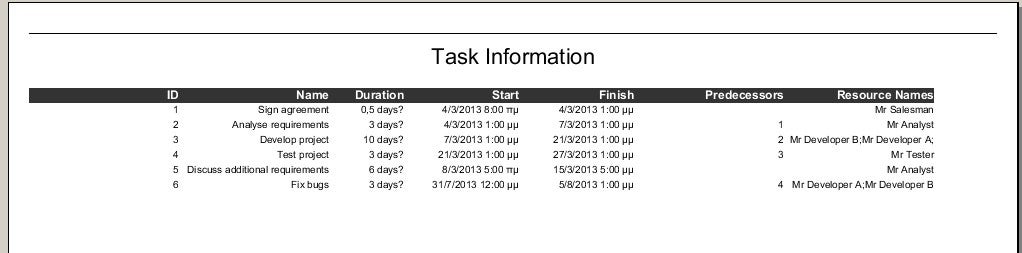
Task Information — Default
The Task Information — Default report displays all the tasks, along with the duration, start, finish, predecessors and resource names. Because of the format of this report, you can export it at Excel or CSV and import it maybe at your own company’s software.
Task Information — Earned Value
Similar to Resource Information—Earned Value report, with this report, you can check the Earned Value per task.
Task Information—Tracking
Very useful report, displaying all the tasks, along with the actual start, actual finish and percent complete. You can also filter the tasks to view Completed, Cost overbudget tasks, Critical tasks, In-progress tasks, Incomplete tasks, Late/overbudget tasks and Normal tasks.
Who Does What— Tasks Assigned
The Who Does What—Tasks Assigned report, is a checklist for your resources (either work or material) to check where they are allocated and how are they doing. You can also filter your resources by Material Resources, Work Resources, In-progress Assignments, Unstarted Assignments, Work Complete.

Epilogue
That was it for the ProjectLibre tutorial. I hope that you have found all 5 five parts useful for your training. You can also check YouTube videos by various people describing various ProjectLibre functionalities.
If you have found a resource (manual and/or guide) you can add it as a comment below for other users to see it.
All tutorial parts: