Our content and product recommendations are editorially independent. We may make money when you click links to our partners. Learn more in our Editorial & Advertising Policy.
Businesses want to discover how to use their data to its fullest potential. All types of company data, from customer data to team performance data, can provide valuable and actionable insights when transformed, explored, and visualized with the right business intelligence tools. Data systems with analytics, dashboards, and reports can help project managers, teams, and stakeholders make data-driven decisions to improve project outcomes.
Read also: How to Write a Project Report
A data system (in the context of digital data management) is a method, process, or technology for collecting, storing, organizing, and maintaining data. Business intelligence is the practice of supporting, promoting, or leveraging methodologies, tools, and technologies to uncover actionable insights from data.
BI tools include software and architecture that enables connection and integration to data systems like databases, data warehouses, data lakes, and other repositories of various types of data. Modern data systems with integrated analytics and reporting can provide BI support to business leaders and project managers, helping them make more informed decisions.
Back to top
Top Data Systems for Project Management BI Support
Here are our top recommendations for data systems and BI tools that enable project teams and stakeholders to receive insights, find trends, and make data-driven decisions.
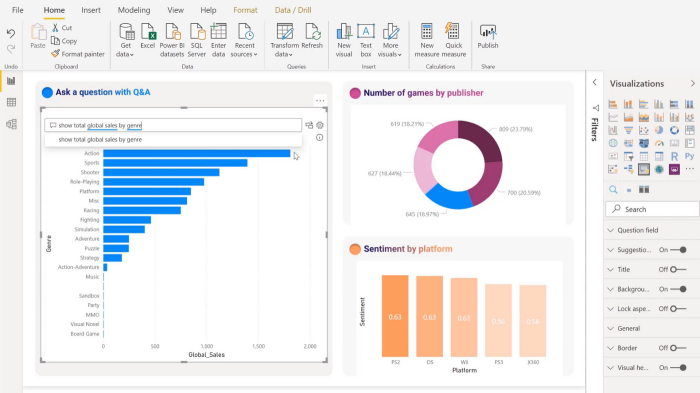
Microsoft Power BI
Microsoft Power BI is a cloud-based service that offers data management system and business analytics capabilities. It enables users to connect to a variety of data — such as project data — and visualize it using a Windows-based desktop app or mobile apps. Users can create personalized reports with KPIs to get answers to project-related questions.
Power BI lets users connect to all data sources to get a comprehensive view of organizational data. It has the capacity to process and analyze large data sets in an accurate, consistent, and secure way. The software solution supports collaboration through integration with Microsoft Office applications and Microsoft Teams. It allows users to work together on the same data and empower everyone to make decisions that drive actions.
Pros
Extensive library of data connectors
Data modeling and blending tools
Power Query automations for data transformation and preparation
Cons
Software has a high learning curve
Compatibility issues with non-Microsoft apps
Microstrategy Analytics
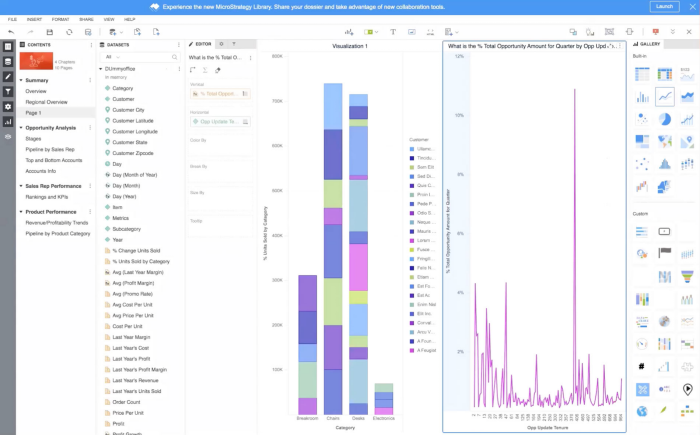
Microstrategy Analytics lets teams connect to a variety of data sources easily. Users can create visualizations with a drag-and-drop canvas, and visualizations will display on any device. They can organize information in pages and chapters, and consolidate it in personalized libraries to run projects more effectively.
Microstrategy Analytics enables data scientists to build, train, and deploy AI across the enterprise, delivering answers and insights to all stakeholders. It has flexible deployment options on the cloud or on-premises. Features include data visualization, location-based analytics, enterprise data assets, self-service dashboards, and formatted reporting.
Pros
Data querying capabilities
Data blending and filtering tools
Centralized dashboards and comprehensive reporting
Cons
Collaboration needs to be easier
Users report program slowdowns with large data sets
Zoho Analytics
Zoho Analytics is self-service business intelligence and analytics software. It lets users connect, prepare, and analyze data from a variety of sources. Essential connectors allow users to connect to files and feeds, cloud storage, and multiple databases. Users can create visualizations and discover insights to improve team and project performance.
Zoho Analytics provides augmented, self-service data preparation and management modules to cleanse, transform, enrich, and catalog data. It provides BI project management and analytics for tools like Zoho Projects, Zoho Sprint, Teamwork, and Jira — so users get a comprehensive view of project data, enriched insights, efficient tracking, and improved delivery. Other tools include an AI assistant, interactive reports and dashboards, and secured sharing and collaboration.
Pros
Interactive graphs and charts
Intelligent dashboards
Pre-built integration
Cons
The data querying feature needs enhancement
Users wish for better API
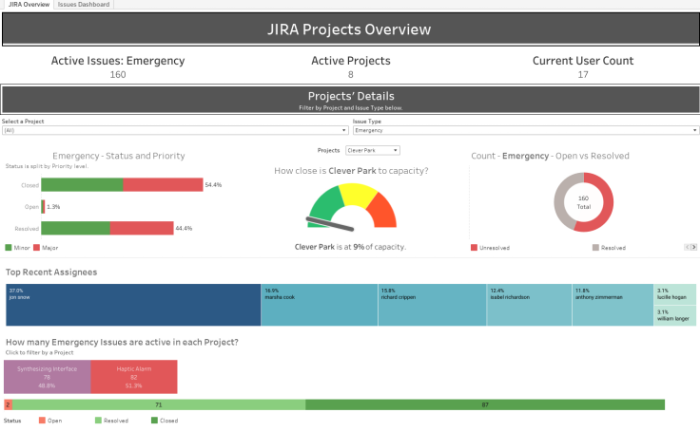
Tableau
Tableau is a visual analytics platform that helps people use data to improve business processes and solve problems. The application makes it easy for users to explore and manage data, as well as discover and share insights. All types of users, from data scientists and students, to executives and business users, are able to connect and collaborate in a secure and flexible platform.
Tableau includes Creators, Explorers, and Viewers to provide users the right set of role capabilities, like preparing data and building content, creating and sharing dashboards from curated sources and content, or simply viewing and interacting with visualizations and dashboards. Native data connectors are compatible with files and databases. It also partners with many data infrastructure and storage providers. Users can use the software to build Gantt charts from Excel, or connect to PM tools like Asana.
Pros
Ease of setup
High-quality data visualizations
Accelerator tools for online apps
Cons
Needs clearer guidelines for new users
Users wish for better API and integration
Qlik Sense
Qlik Sense is a cloud analytics system that enables users of all skill levels to explore data freely and quickly. It provides self-service visualization, so users can easily combine, load, and visualize data to get answers. They can search, select, drill down, or zoom out from interactive charts, tables, and objects.
Qlik Sense enables users to create, share, and distribute powerful dashboards to support project teams and keep stakeholders in the loop. Other features include search-based visual discovery, conversational natural language, flexible reporting, MS Office and PDF output formats, alerts, automation, native mobile apps, and ML integration.
Pros
Data filtering and blending features
Automatic modeling
Easy creation of dashboards
Cons
Inconsistent performance with big data
Users wish for clearer API documentation
Looker
Looker is a business intelligence and data analytics platform that is now part of Google Cloud. It lets users create real-time dashboards for in-depth analysis. Its data management system ensures delivery of trustworthy data, allowing project teams to generate up-to-date reports. Users can create custom apps that deliver unique data experiences.
Looker supports different SQL dialects to allow teams to connect to multiple databases and maintain multi-cloud environments. Users can define how different data sources relate to one another for more comprehensive BI support. They also have full control of what information their data shows. Visualization options include funnel, maps, multiple gauges, timeline, multiple donuts, sankey, treemap, and combined charts.
Pros
Data filtering and querying
Auto-modeling
Responsive support
Cons
Graphs and charts need improvement
Steep learning curve for new users
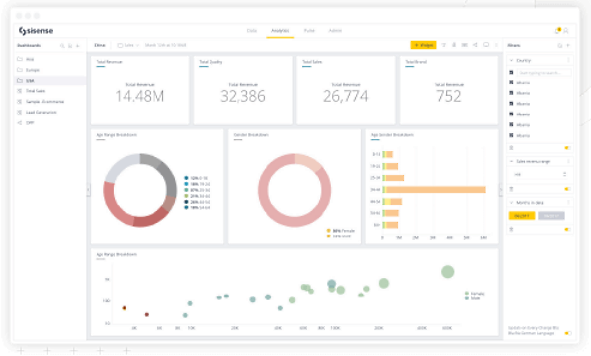
Sisense Fusion
Sisense Fusion is data analytics software that users can embed and infuse into workflows, business processes, applications, and products. It simplifies data analysis, so users can apply it wherever needed and make better business decisions. It is applicable to a variety of projects and use cases across departments and industries.
Sisense Fusion lets users connect data from the cloud, applications, and on-premises infrastructure for a more comprehensive view. Users can analyze with Python, R, and SQL, or use code-free tools. It provides predictive analytics and machine learning. It is also customizable for a self-service experience. Other tools include dashboard templates and natural language querying.
Pros
Intuitive reports interface
Dashboards and data visualizations
Caters to both beginners and advanced users
Cons
Mobile experience needs improvement
Users wish for more how-to videos
Logi Analytics
Logi Analytics is a data analytics and reporting tool for applications. Ideal for software development project teams, it allows users to embed analytics in applications for a personalized experience. White-labeled dashboards and data visualization tools, with the option for low code or full platform, are available. Teams can add analytics to an existing application or build a custom analytics app from over 800 pre-built widgets.
Logi Analytics lets users create and apply themes to embedded dashboards and extend functionality with JavaScript APIs. Customized self service allows for data drill down, changing chart types, sorting, zooming, grouping, and filtering across visuals. It connects to a variety of data sources like structured and unstructured data, search, real-time, and document-based data. Users can generate fully customizable reports for various requirements.
Pros
Auto-modeling features
Extensive customization
Easy to create reports
Cons
Poses a challenge for non-developers
Inconsistent performance with bigger data sets
Mode
Mode is a collaborative data systems platform for teams. It provides tools and features like cloud SQL editors, Python notebooks, and interactive visualizations for self-service. It allows product teams to understand better how consumers are interacting with their product, identify opportunities, and make decisions. Finance teams can generate ad hoc revenue reports, sales and marketing teams can identify weak spots in the funnel, while operation teams can monitor infrastructure to improve business processes.
Mode tools include a collaborative SQL editor, native R and Python notebooks, a visual explorer for data exploration, and reports and dashboards for instant insights. Users can create and reuse custom formulas, use drag-and-drop analysis, and present data in a wide range of interactive charts and tables.
Pros
Ready-built data connectors
Data querying tools
Ease of setup and use
Cons
Report designs need enhancement
Users wish for additional customization
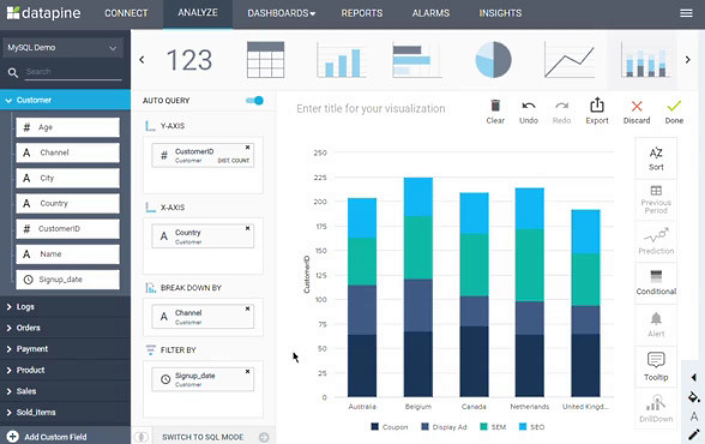
Datapine
Datapine is a business intelligence and dashboard platform. Interactive dashboards give teams access to relevant company data and allow them to make data-driven decisions on any occasion. Users across the organization can generate actionable insights through self-service analytics. Centralized and secure data sources support workflows and decision-making that improves project outcomes and increases organizational efficiency.
Datapine has ready-to-use data connectors to relational databases, flat files, ERP/CRM, web analytics, social media, and help desk apps. A self-service BI tool with drag-and-drop UI makes data discovery simple. Other features include over 80 business dashboard templates, customizable dashboard design, slice-and-dice interactivity, online reporting software for multiple data sharing options, and a built-in predictive analytics tool.
Pros
Connectors and APIs for integration
Data querying feature
Ease of setup and use
Cons
Advanced features in SQL tool can overwhelm new users
Users wish for a longer trial period than 14 days to explore all features
Different types of BI tools and analytics applications incorporate a combination of data systems, analysis, visualization, and reporting, through self-service software and/or traditional platforms to meet different information needs.
Descriptive Analytics
Descriptive analytics interprets historical data to allow users to better understand changes that have occurred in a business or in previous projects. It helps organizations make better decisions by identifying patterns. The two methods used are data aggregation and data mining for uncovering trends and patterns. This type of software’s main concern is representing what has happened in the past.
Predictive Analytics
Predictive analytics tools use statistics and modeling techniques to make predictions about future outcomes and performance. The software looks at current and historical data patterns to determine if those patterns are likely to emerge again. It is a more advanced method that uses data mining, statistical modeling, and machine learning algorithms to make predictions. Predictive analytics in project management aims to keep projects within scope, time, and budget by helping prevent problems before they arise.
Prescriptive Analytics
Prescriptive analytics analyses raw data and factors in information about possible scenarios, available resources, past performance, and current performance to suggest a course of action or strategy. It uses a variety of statistical methods, gathers data from a range of descriptive and predictive sources, and applies algorithms to measure the repercussions of a decision. Then, the software recommends the best course of action to achieve a pre-defined goal.
Read also: The Discovery Phase: Is It Important?Back to top
Important Features in Project Management BI Support
The ultimate goal of organizations implementing BI systems is to have the capability to make better business decisions. The following are important BI features and functionality to support project management and improve project outcomes.
Ad hoc analysis or querying: The process of writing and running queries to analyze specific PM issues, with the option to save and reuse the queries and incorporate them into dashboards.
Real-time analysis: Analysis of data during creation, collection, or processing to give users an up-to-date view of information.
Embedded analytics: BI functionality and data visualization incorporated directly into business applications, such as custom in-house project management applications created by corporate software developers or external consultants.
Collaborative analytics: Combination of analytics software and collaboration tools to allow different users to work together on data analysis and share information.
Location intelligence: Specialized information that enables users to analyze location and geospatial data with built-in, map-based visualization. Some potential uses include construction site selection and supply chain management.
Mobile BI: Availability of apps and dashboards on smartphones and tablets, with an emphasis on ease of use, to display selected KPIs and visualizations on smaller screens.
Online analytical processing (OLAP): Data analysis along multiple dimensions. OLAP tools can provide an integrated view of the relationships and inter-dependencies between individual work tasks and other project components, providing flexible and efficient analysis of project data.
Jose Santos is a long-time writer for project-management.com. He is a subject matter expert in the field of project management and has many years of experience writing about project management software and tools. He has written hundreds of articles for the project management industry, including numerous software reviews, book reviews, training site reviews, and more.
 Pros
Pros
 Pros
Pros
 Pros
Pros
 Pros
Pros
 Pros
Pros
 Pros
Pros
 Pros
Pros
 Pros
Pros
 Pros
Pros
 Pros
Pros