


Key takeaways
The RACI matrix, which stands for Responsible, Accountable, Consulted, and Informed, is a tool used to clarify task ownership in project management. While effective, it can feel too rigid or oversimplified for projects that require more flexibility.
A Wellingtone report reveals that only 47% of projects are handled by a project manager, which makes exploring role clarity models even more critical for teams without formal oversight. In this article, I will walk you through the best RACI alternatives, their use cases, and how to choose the right one for your projects.
- What is a RACI matrix and what does it look like?
- 1. RASCI – Best for clarifying support roles
- 2. DACI – Best for defining decision authority
- 3. RAPID – Best for outlining decision-making roles
- 4. PACSI – Best for compliance-heavy work
- 5. ARPA – Best for large-scale initiatives
- RACI alternatives compared
- Which RACI alternative fits your project? Use these examples
- What are the factors to consider when choosing the right framework?
- FAQs
What is a RACI matrix and what does it look like?
RACI matrix is a project management tool that visually defines task ownership within a project lifecycle. It consists of four key roles (Responsible, Accountable, Consulted, and Informed) that indicate who does what in any project task, creating a framework that maps responsibilities across team members to help manage expectations and avoid confusion. So if you’ve ever struggled with unclear roles on a project, the RACI matrix can help.
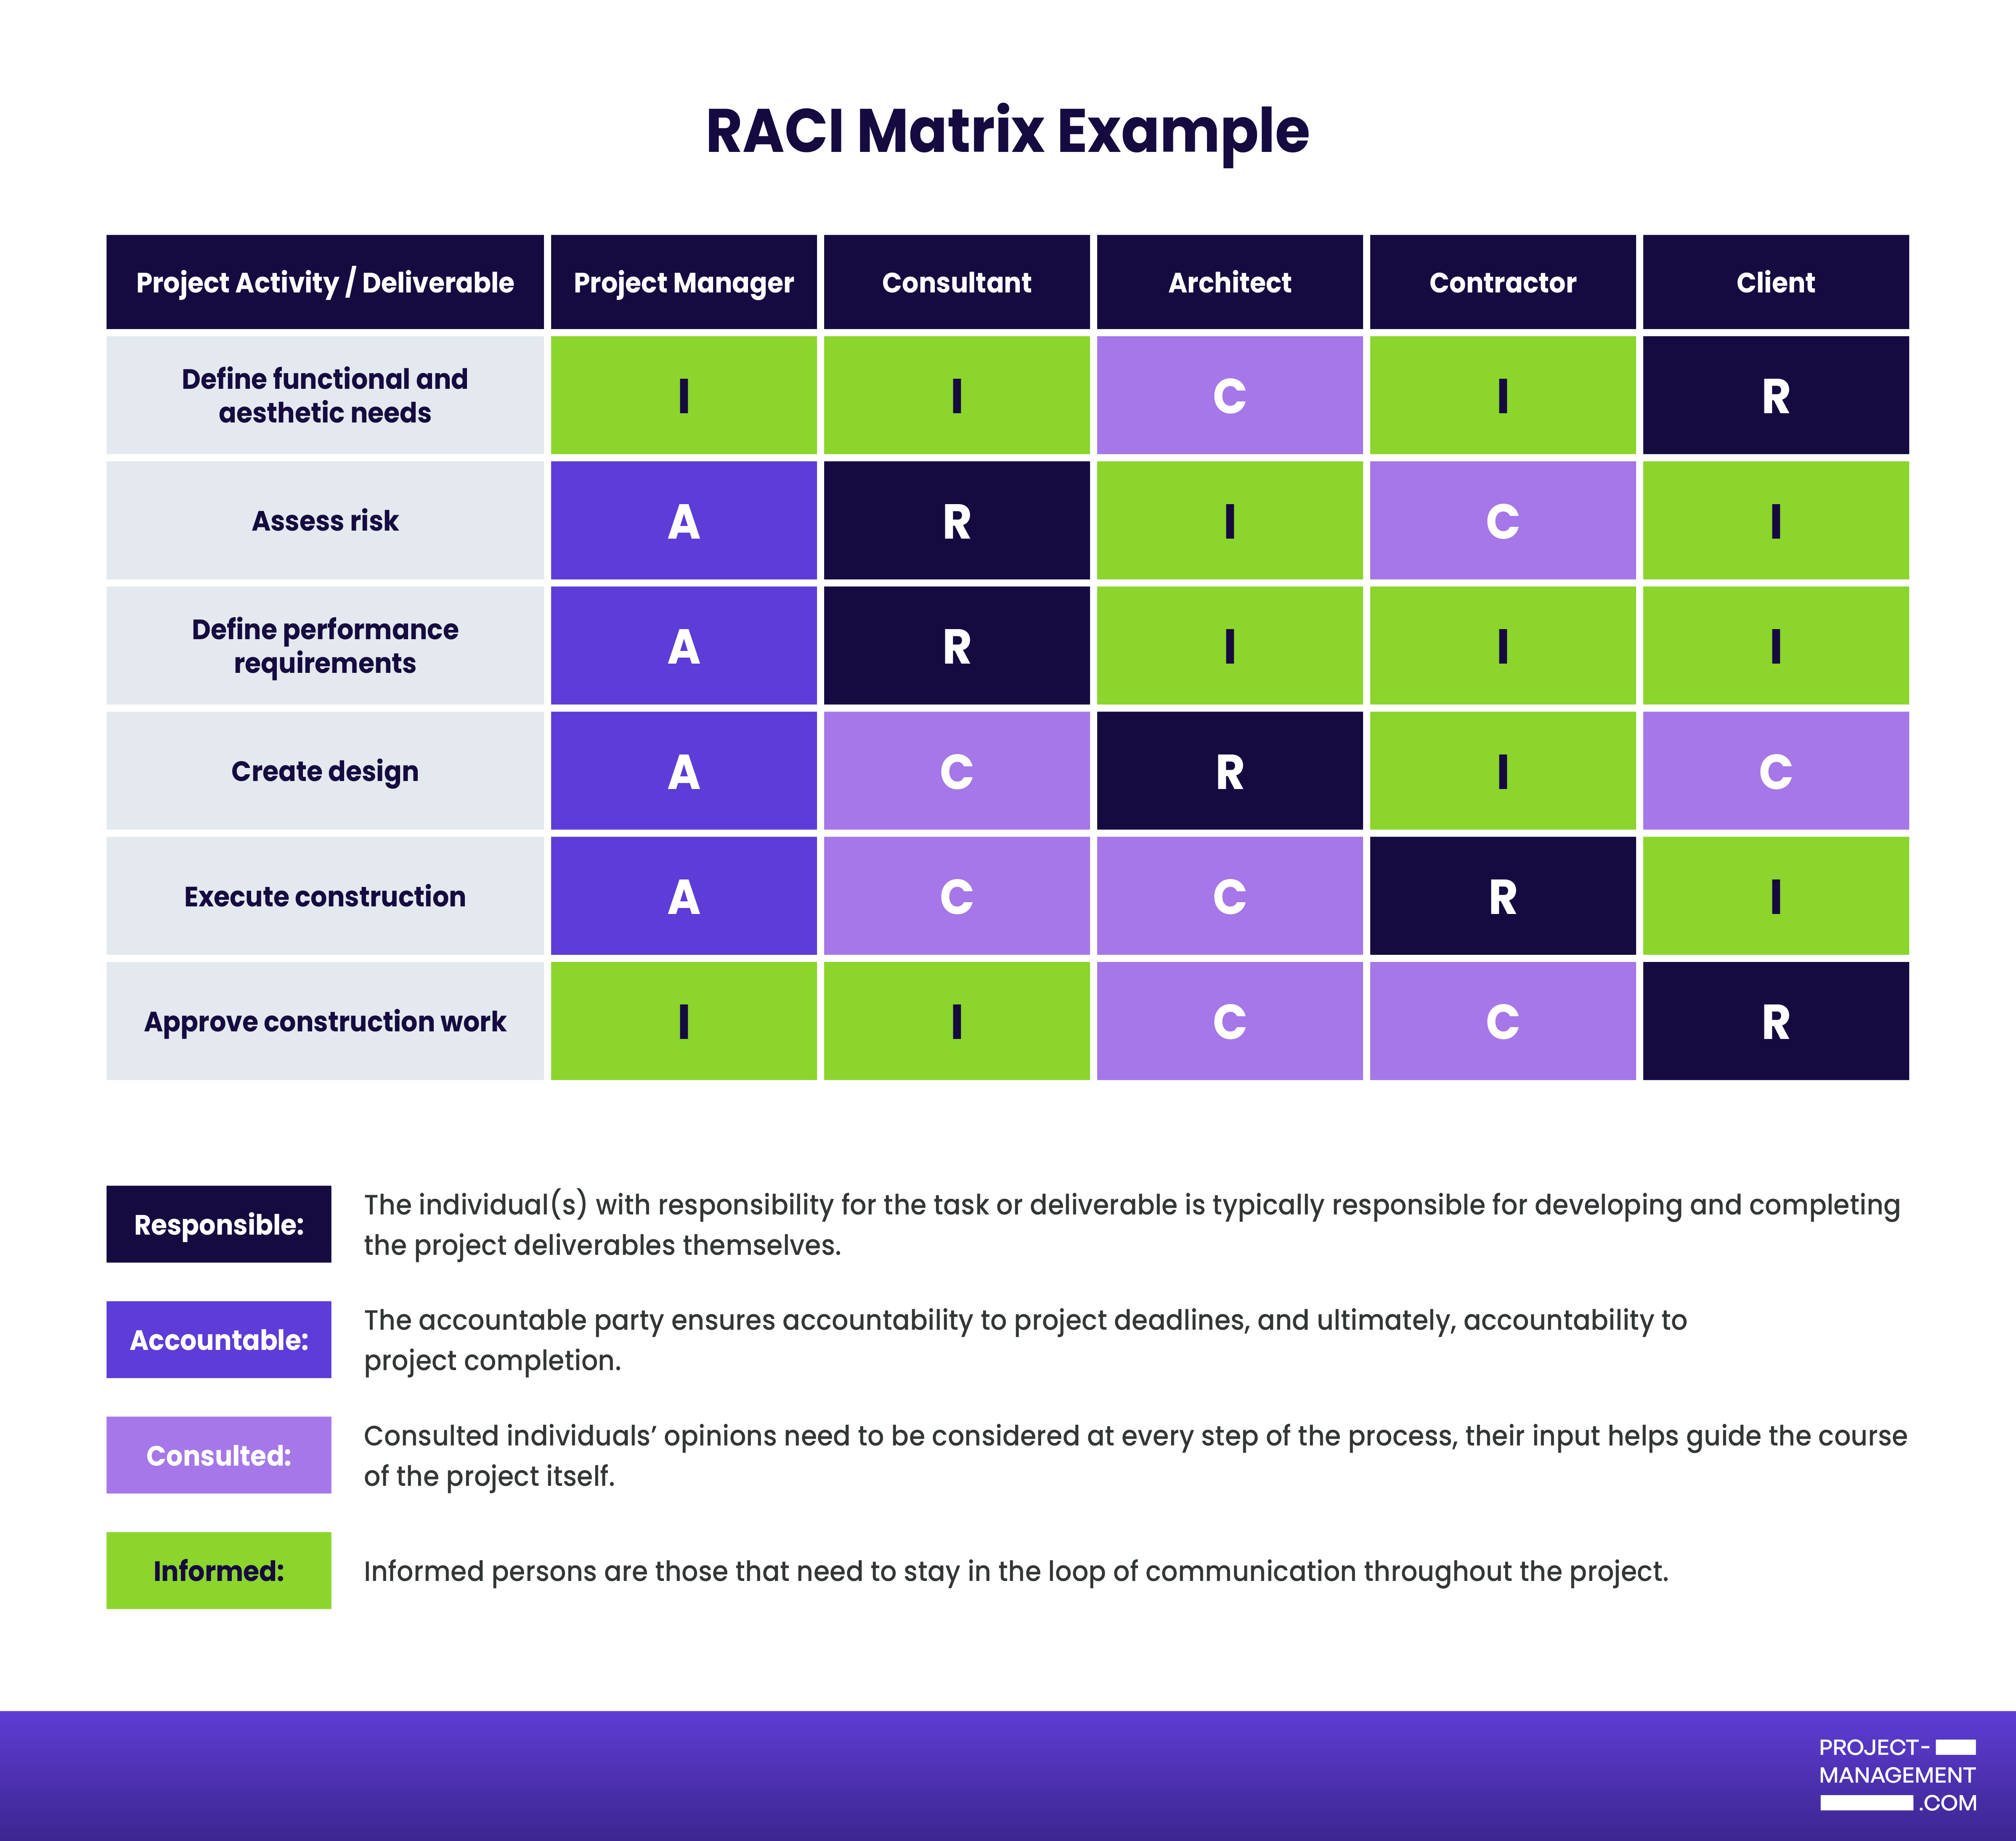
In project management, the RACI model is used for assigning and visualizing roles for each deliverable or decision. It’s laid out in a matrix format, where tasks are listed in rows and team members in columns. Each cell of the matrix shows a letter (R, A, C, or I) to indicate that person’s involvement or participation in a particular task.
To better understand the use of the RACI matrix, below I outline its strengths and where it may fall short depending on your team’s needs.
Benefits of RACI
Limitations of RACI
1. RASCI – Best for clarifying support roles
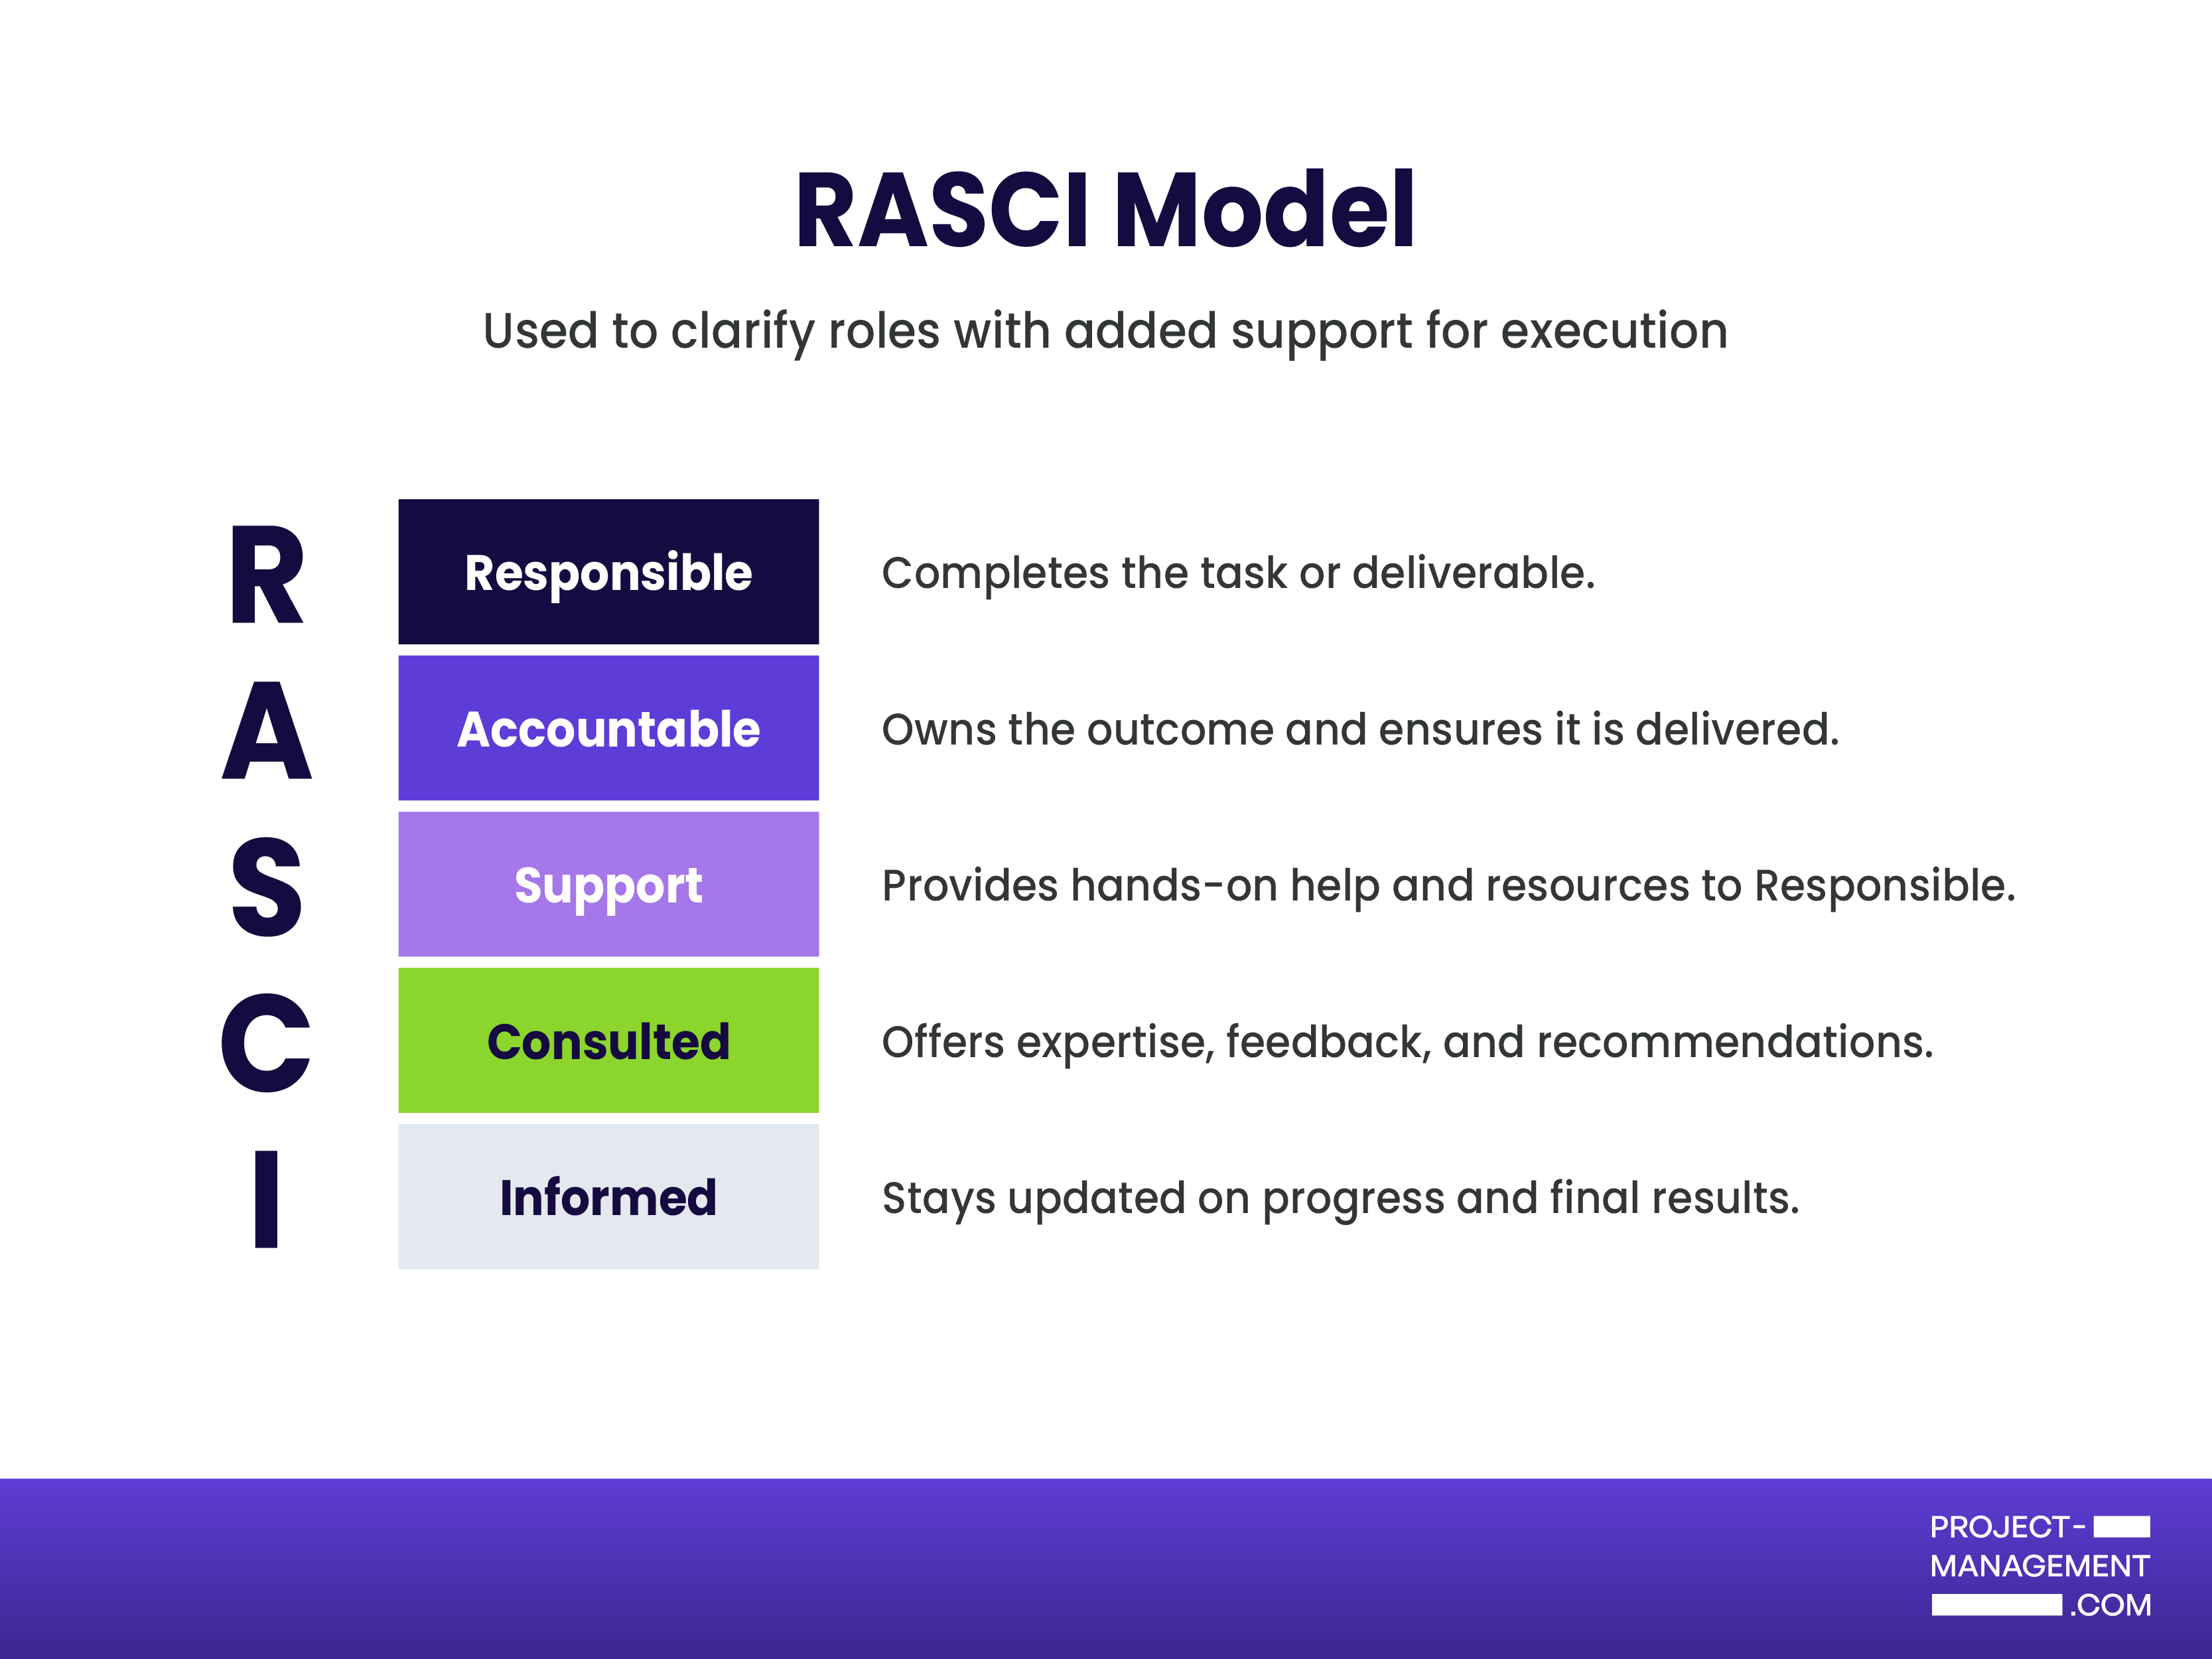
RASCI (Responsible • Accountable • Support • Consulted • Informed) uses accountability matrices that add Support to the classic RACI so you can identify who actively assists the person responsible for delivering the work.
The Support role represents individuals who provide hands-on help, such as technical specialists or design staff, rather than simply advising or being informed. Including this role reduces ambiguity in shared-service environments by clarifying who provides direct assistance and how their efforts interact with accountable and responsible roles.
Real-life example of RASCI
You are running a product launch where the product marketer is Accountable, the campaign manager is Responsible, designers and developers provide Support, legal is Consulted, and executives are Informed. This setup speeds asset creation while keeping sign-offs and updates clear.
How to implement RASCI
- List key tasks and deliverables.
- Identify and map all stakeholders who touch the work.
- Assign one Accountable per task, then one Responsible where possible.
- Add Support roles that provide hands-on help, then mark Consulted and Informed.
- Review the matrix with the team, publish it where everyone can see it, and revisit after the first sprint or milestone.
2. DACI – Best for defining decision authority
DACI (Driver • Approver • Consulted • Informed) defines who Drives the work, who Approves the decision, who Contributes expertise, and who is Informed of the outcome. It’s a framework designed to accelerate cross-functional decision-making by assigning a single Approver and a Driver responsible for keeping work on track. DACI is especially effective when multiple specialists are involved, but a timely decision from one accountable leader is required.
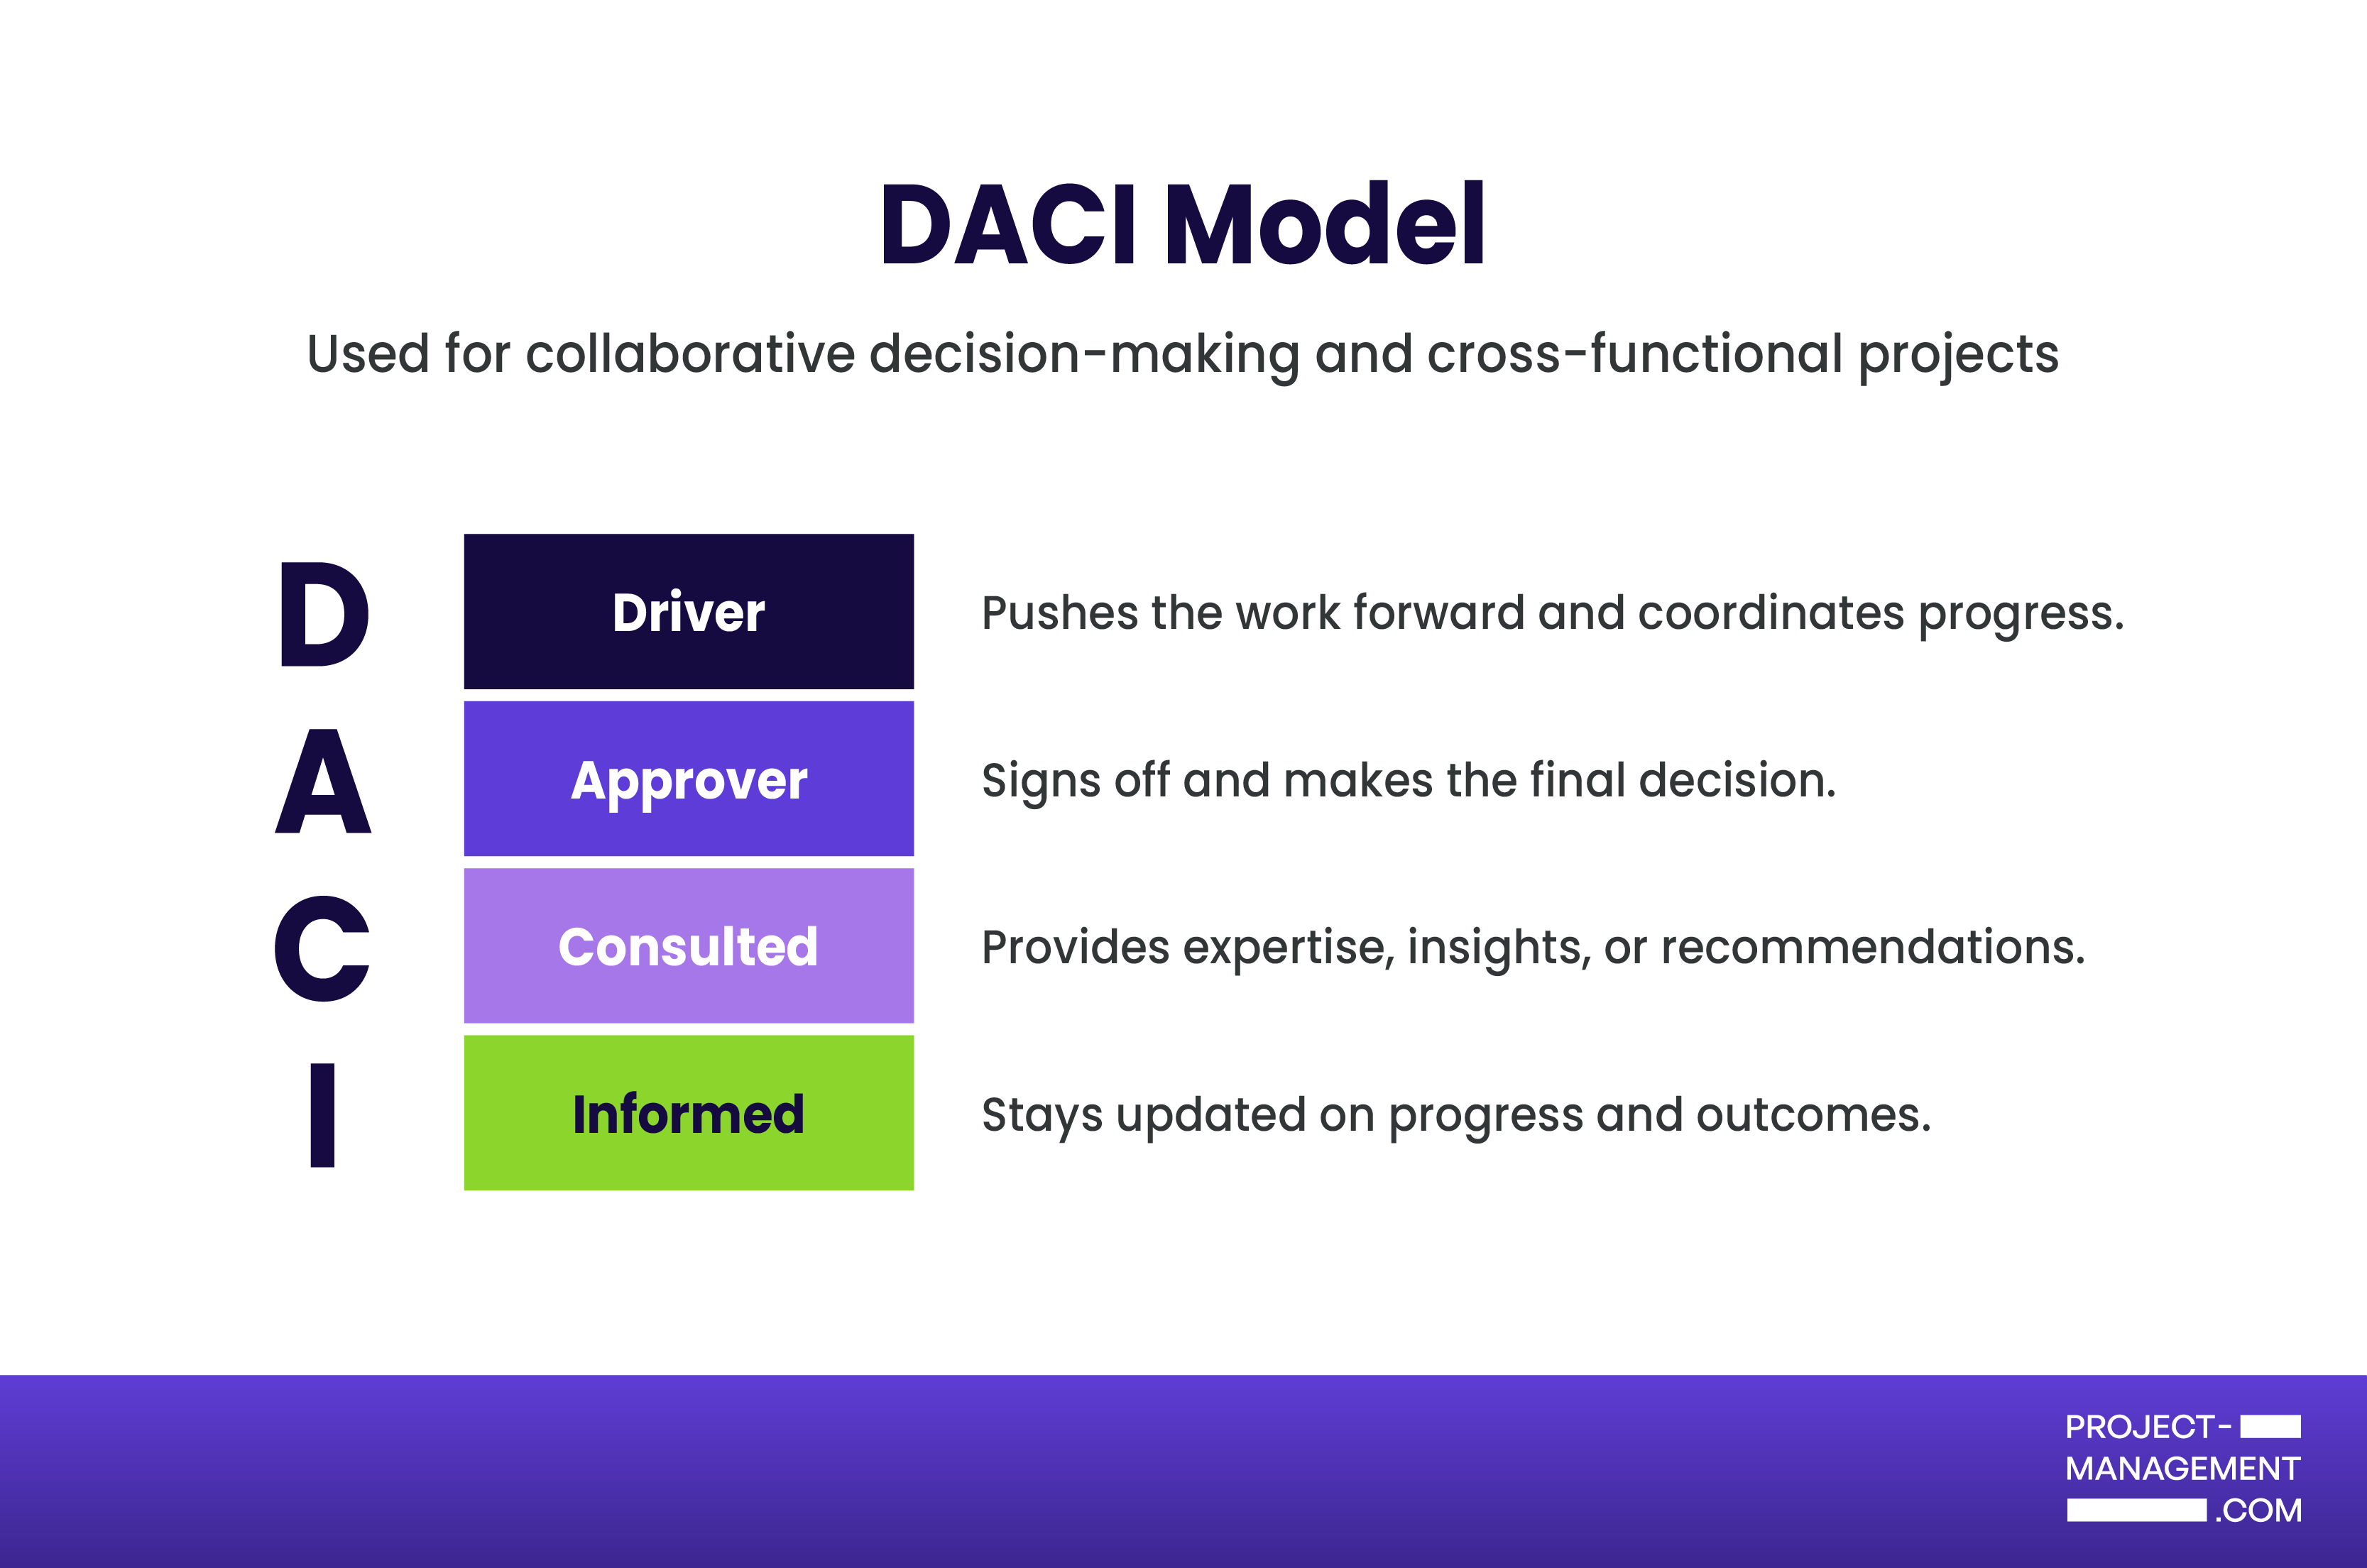
Real-life example of DACI
You are selecting a marketing automation platform with the product marketing manager as Driver and the VP of Marketing as Approver. Sales operations and engineering act as Contributors, while customer support and finance stay Informed about the final selection and rollout plan.
How to implement DACI
- Define the decision scope and success criteria.
- Name one Approver with final authority.
- Assign a Driver to coordinate work and deadlines.
- List Contributors and the expertise each will provide.
- Identify who must be Informed and how updates are delivered.
- Set a decision timeline and capture the final rationale in a decision log.
3. RAPID – Best for outlining decision-making roles
Among decision-making frameworks, RAPID (Recommend • Agree • Perform • Input • Decision) stands out by clarifying who Recommends, who must Agree, who Performs, who provides Input, and who Decides. You use it when decisions require buy-in, or for high-impact choices like vendor selection, pricing changes, or policy updates.
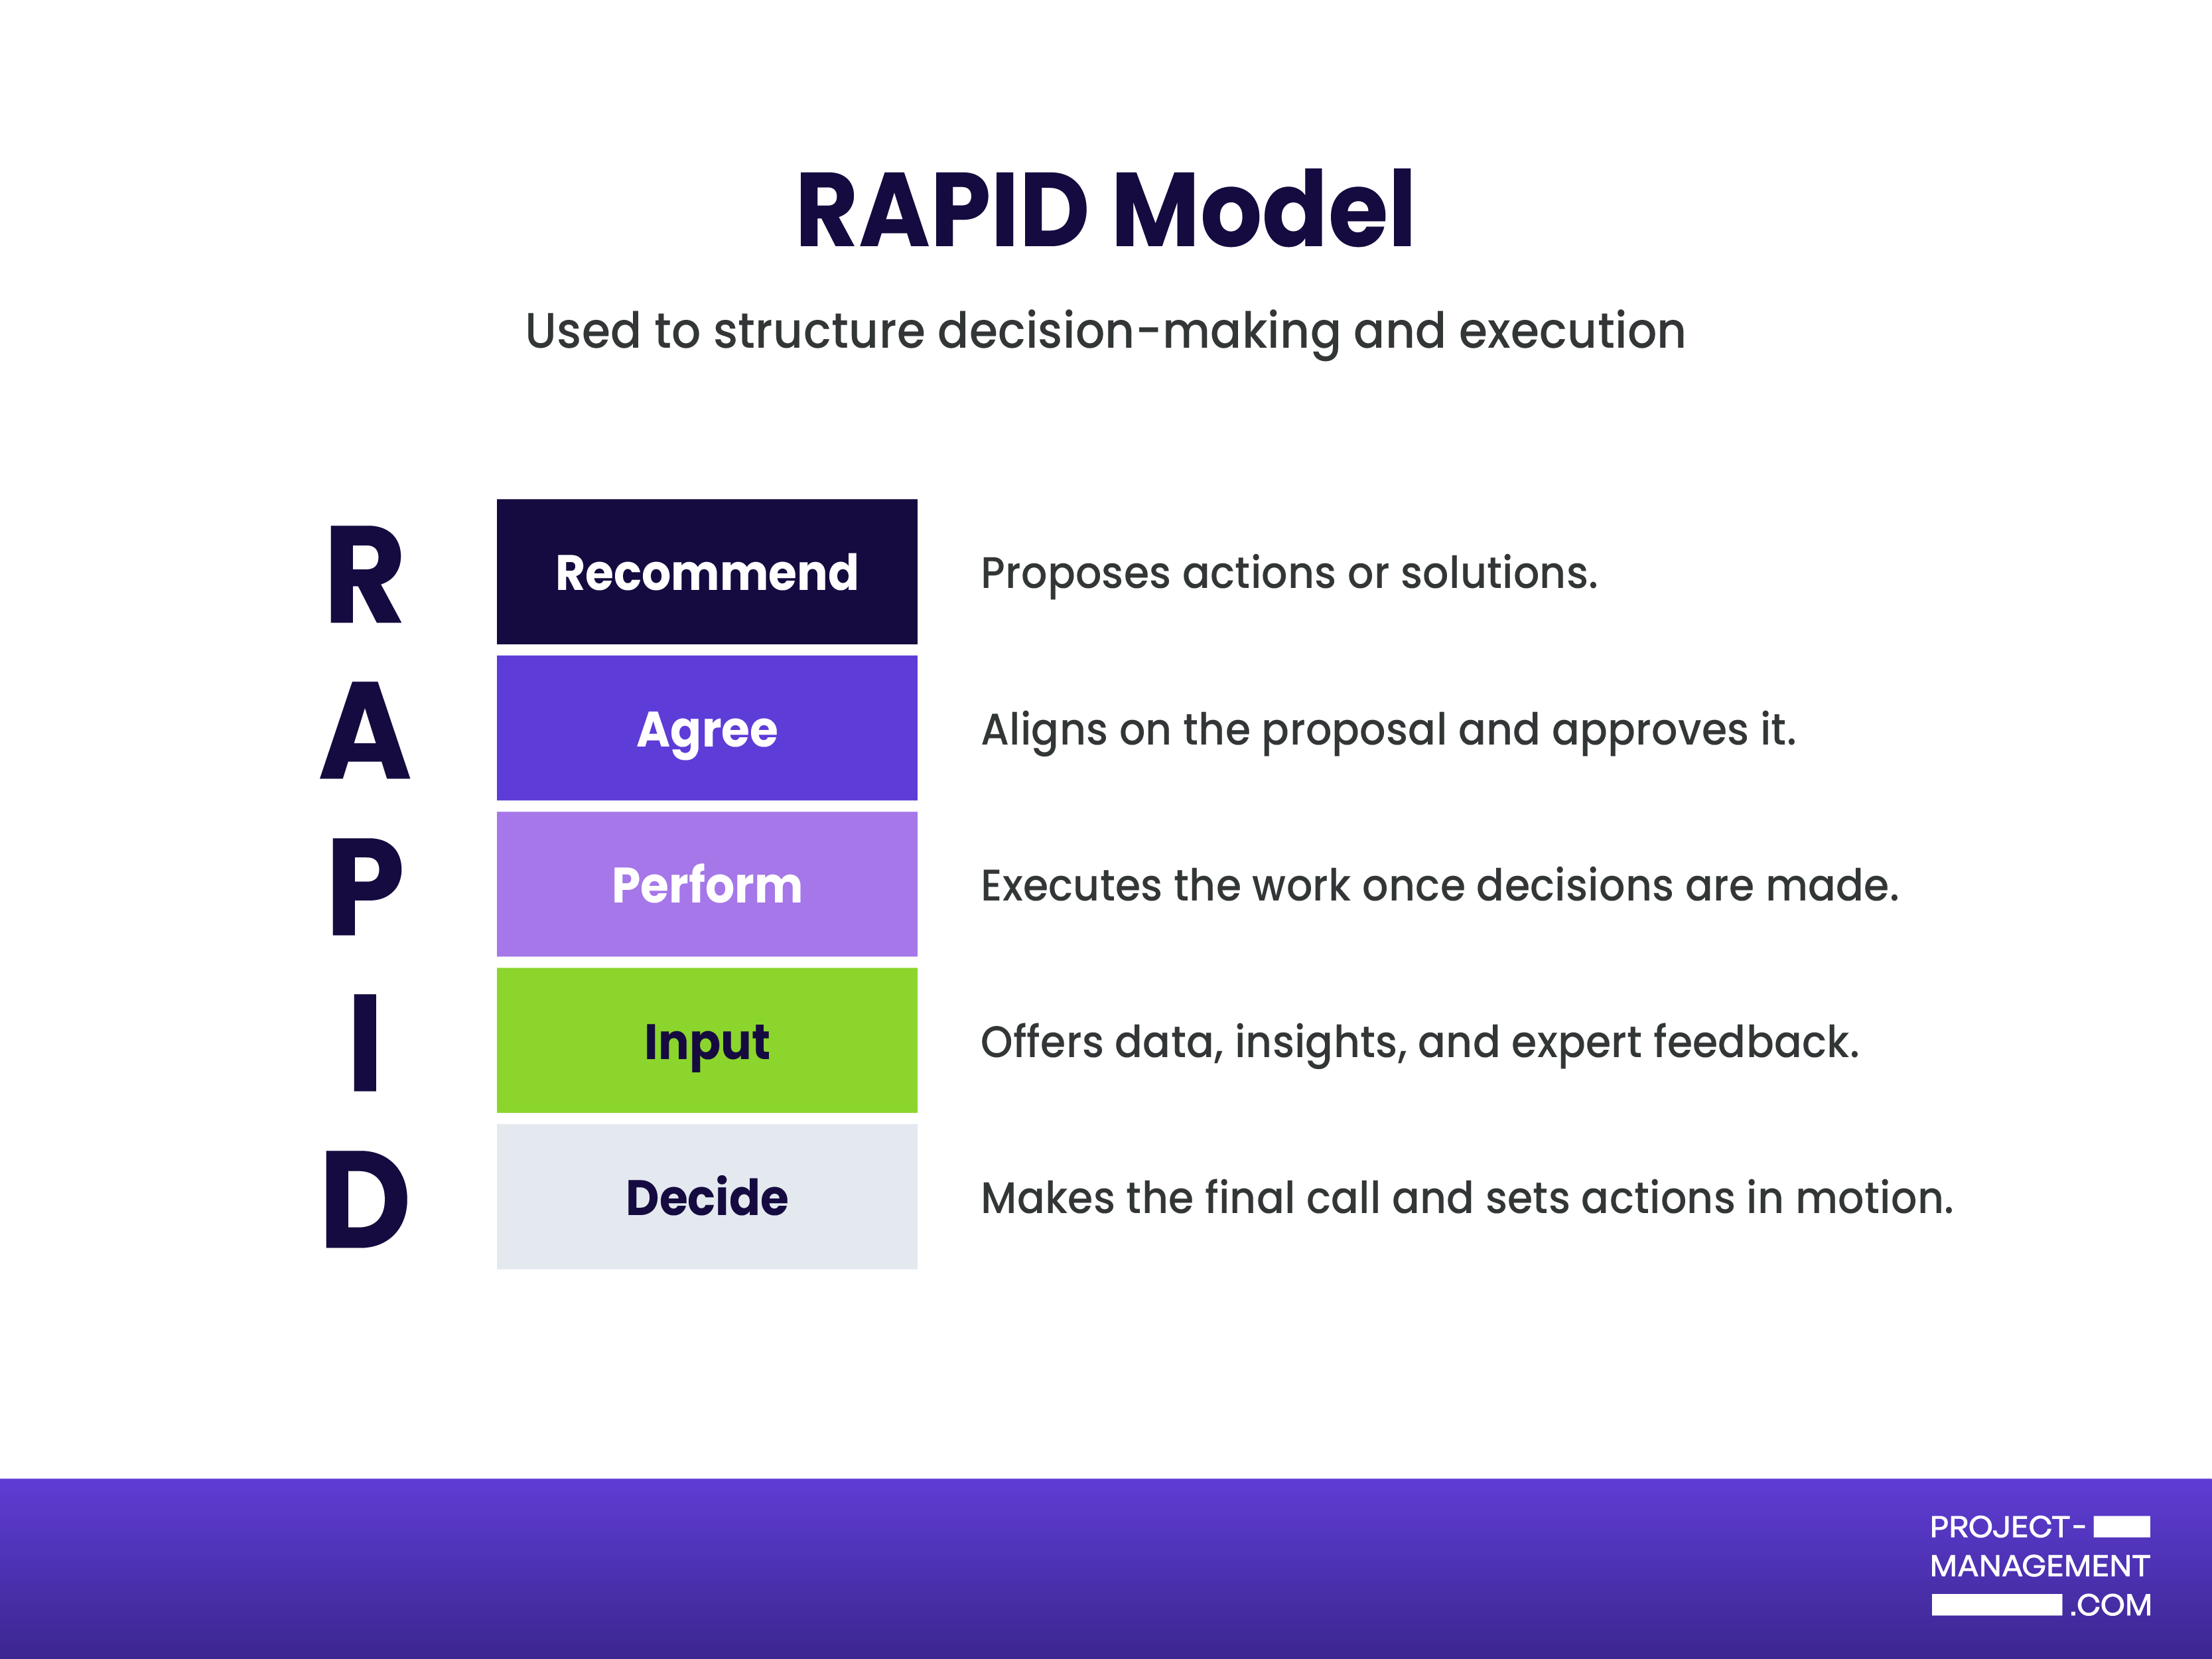
Real-life example of RAPID
For a cloud vendor downselect, the architecture lead Recommends, security and finance Agree, several engineers and analysts provide Input, the CIO Decides, and the platform team Performs the migration. Everyone knows their role before the evaluation begins, which keeps the process transparent and quick.
How to implement RAPID
- Write a decision statement and guardrails.
- Appoint the Decider early.
- Choose a Recommender to synthesize options and evidence.
- Identify Agree roles with veto or compliance needs.
- Gather Input sources and deadlines for data.
- Assign the Performer for execution and plan the handoff after the decision.
4. PACSI – Best for compliance-heavy work
PACSI (Perform • Accountable • Control • Suggest • Informed) is particularly useful for managing quality and compliance. You use it when deliverables must meet standards and pass formal checks. It fits regulated work and audits, where validation is as important as speed.
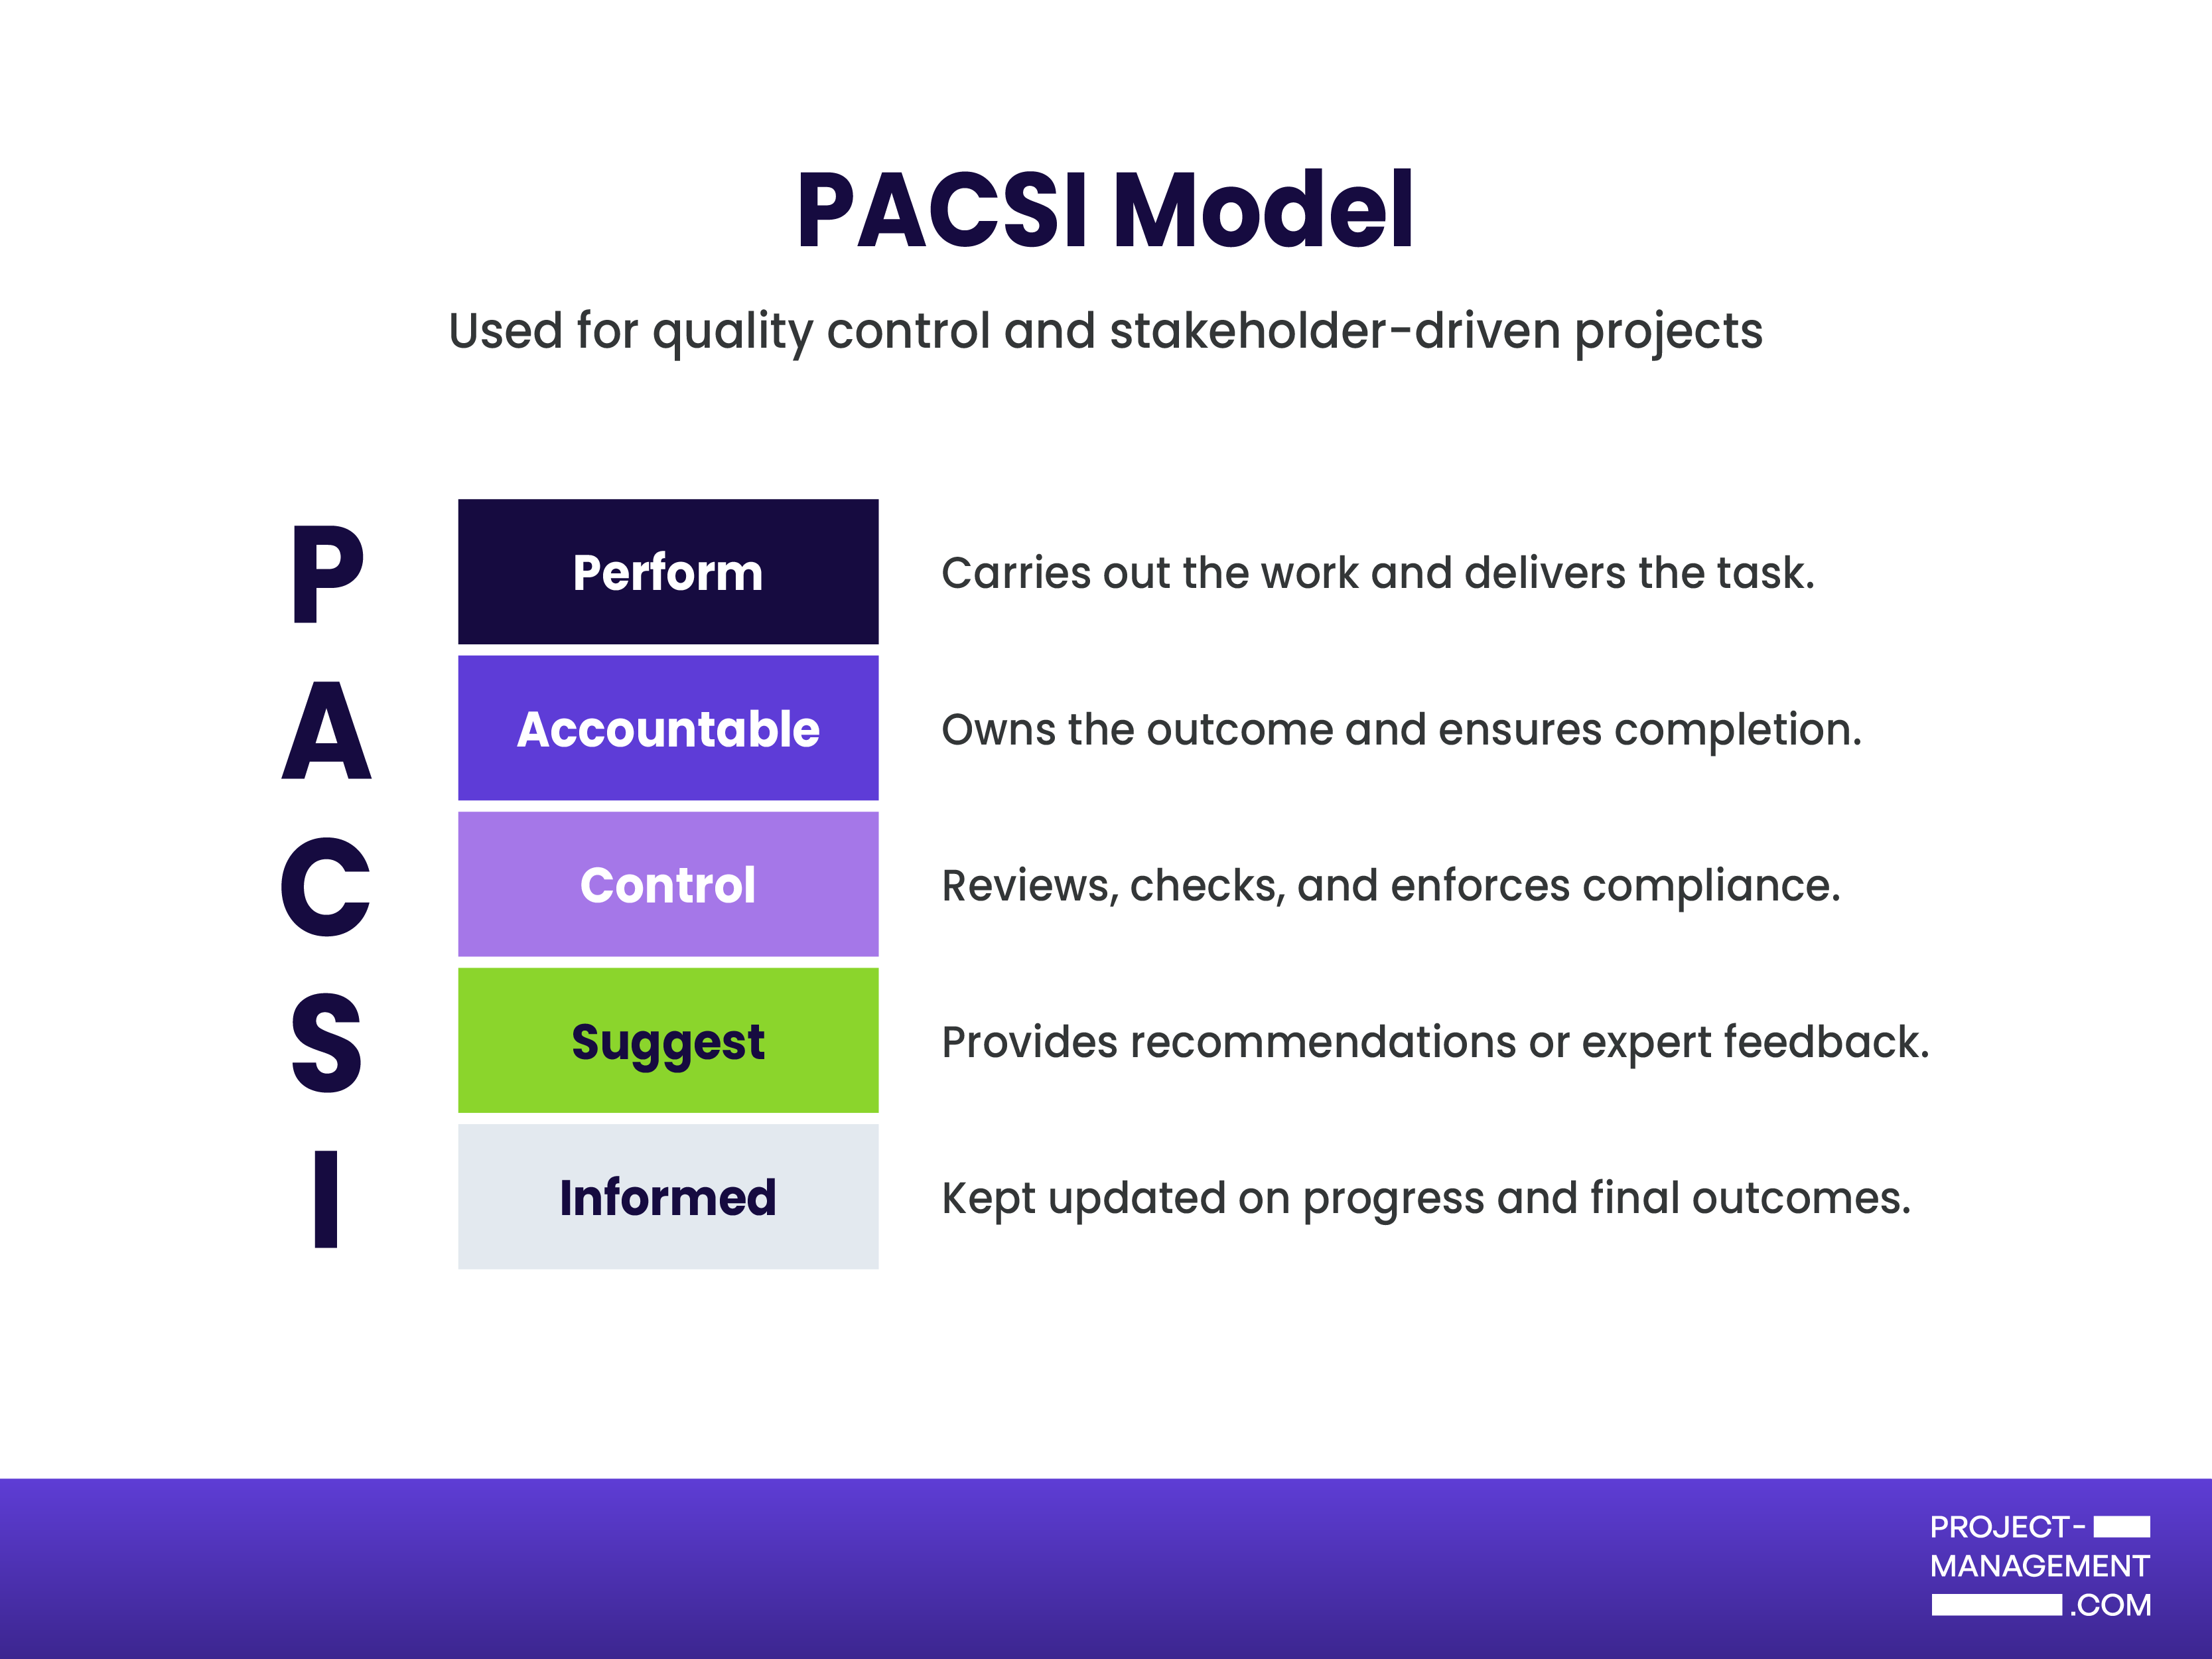
Real-life example of PACSI
During a cybersecurity policy update, the security analyst Performs the draft, the CISO is Accountable, the compliance officer exercises Control through reviews, SMEs Suggest improvements, and department heads are Informed at release.
How to implement PACSI
- Break the work into reviewable deliverables.
- Assign one Accountable owner per deliverable.
- Name Performers and define acceptance criteria.
- Appoint Control for checkpoints, testing, or approvals.
- Add Suggest roles for subject matter feedback.
- List Informed stakeholders and schedule status communications.
5. ARPA – Best for large-scale initiatives
ARPA (Authority • Responsibility • Process • Accountability) can be used for projects that require building clear governance for complex initiatives. You use it to standardize decision rights and escalation paths across programs and portfolios. It is well-suited for large transformations where process discipline and traceability are required.
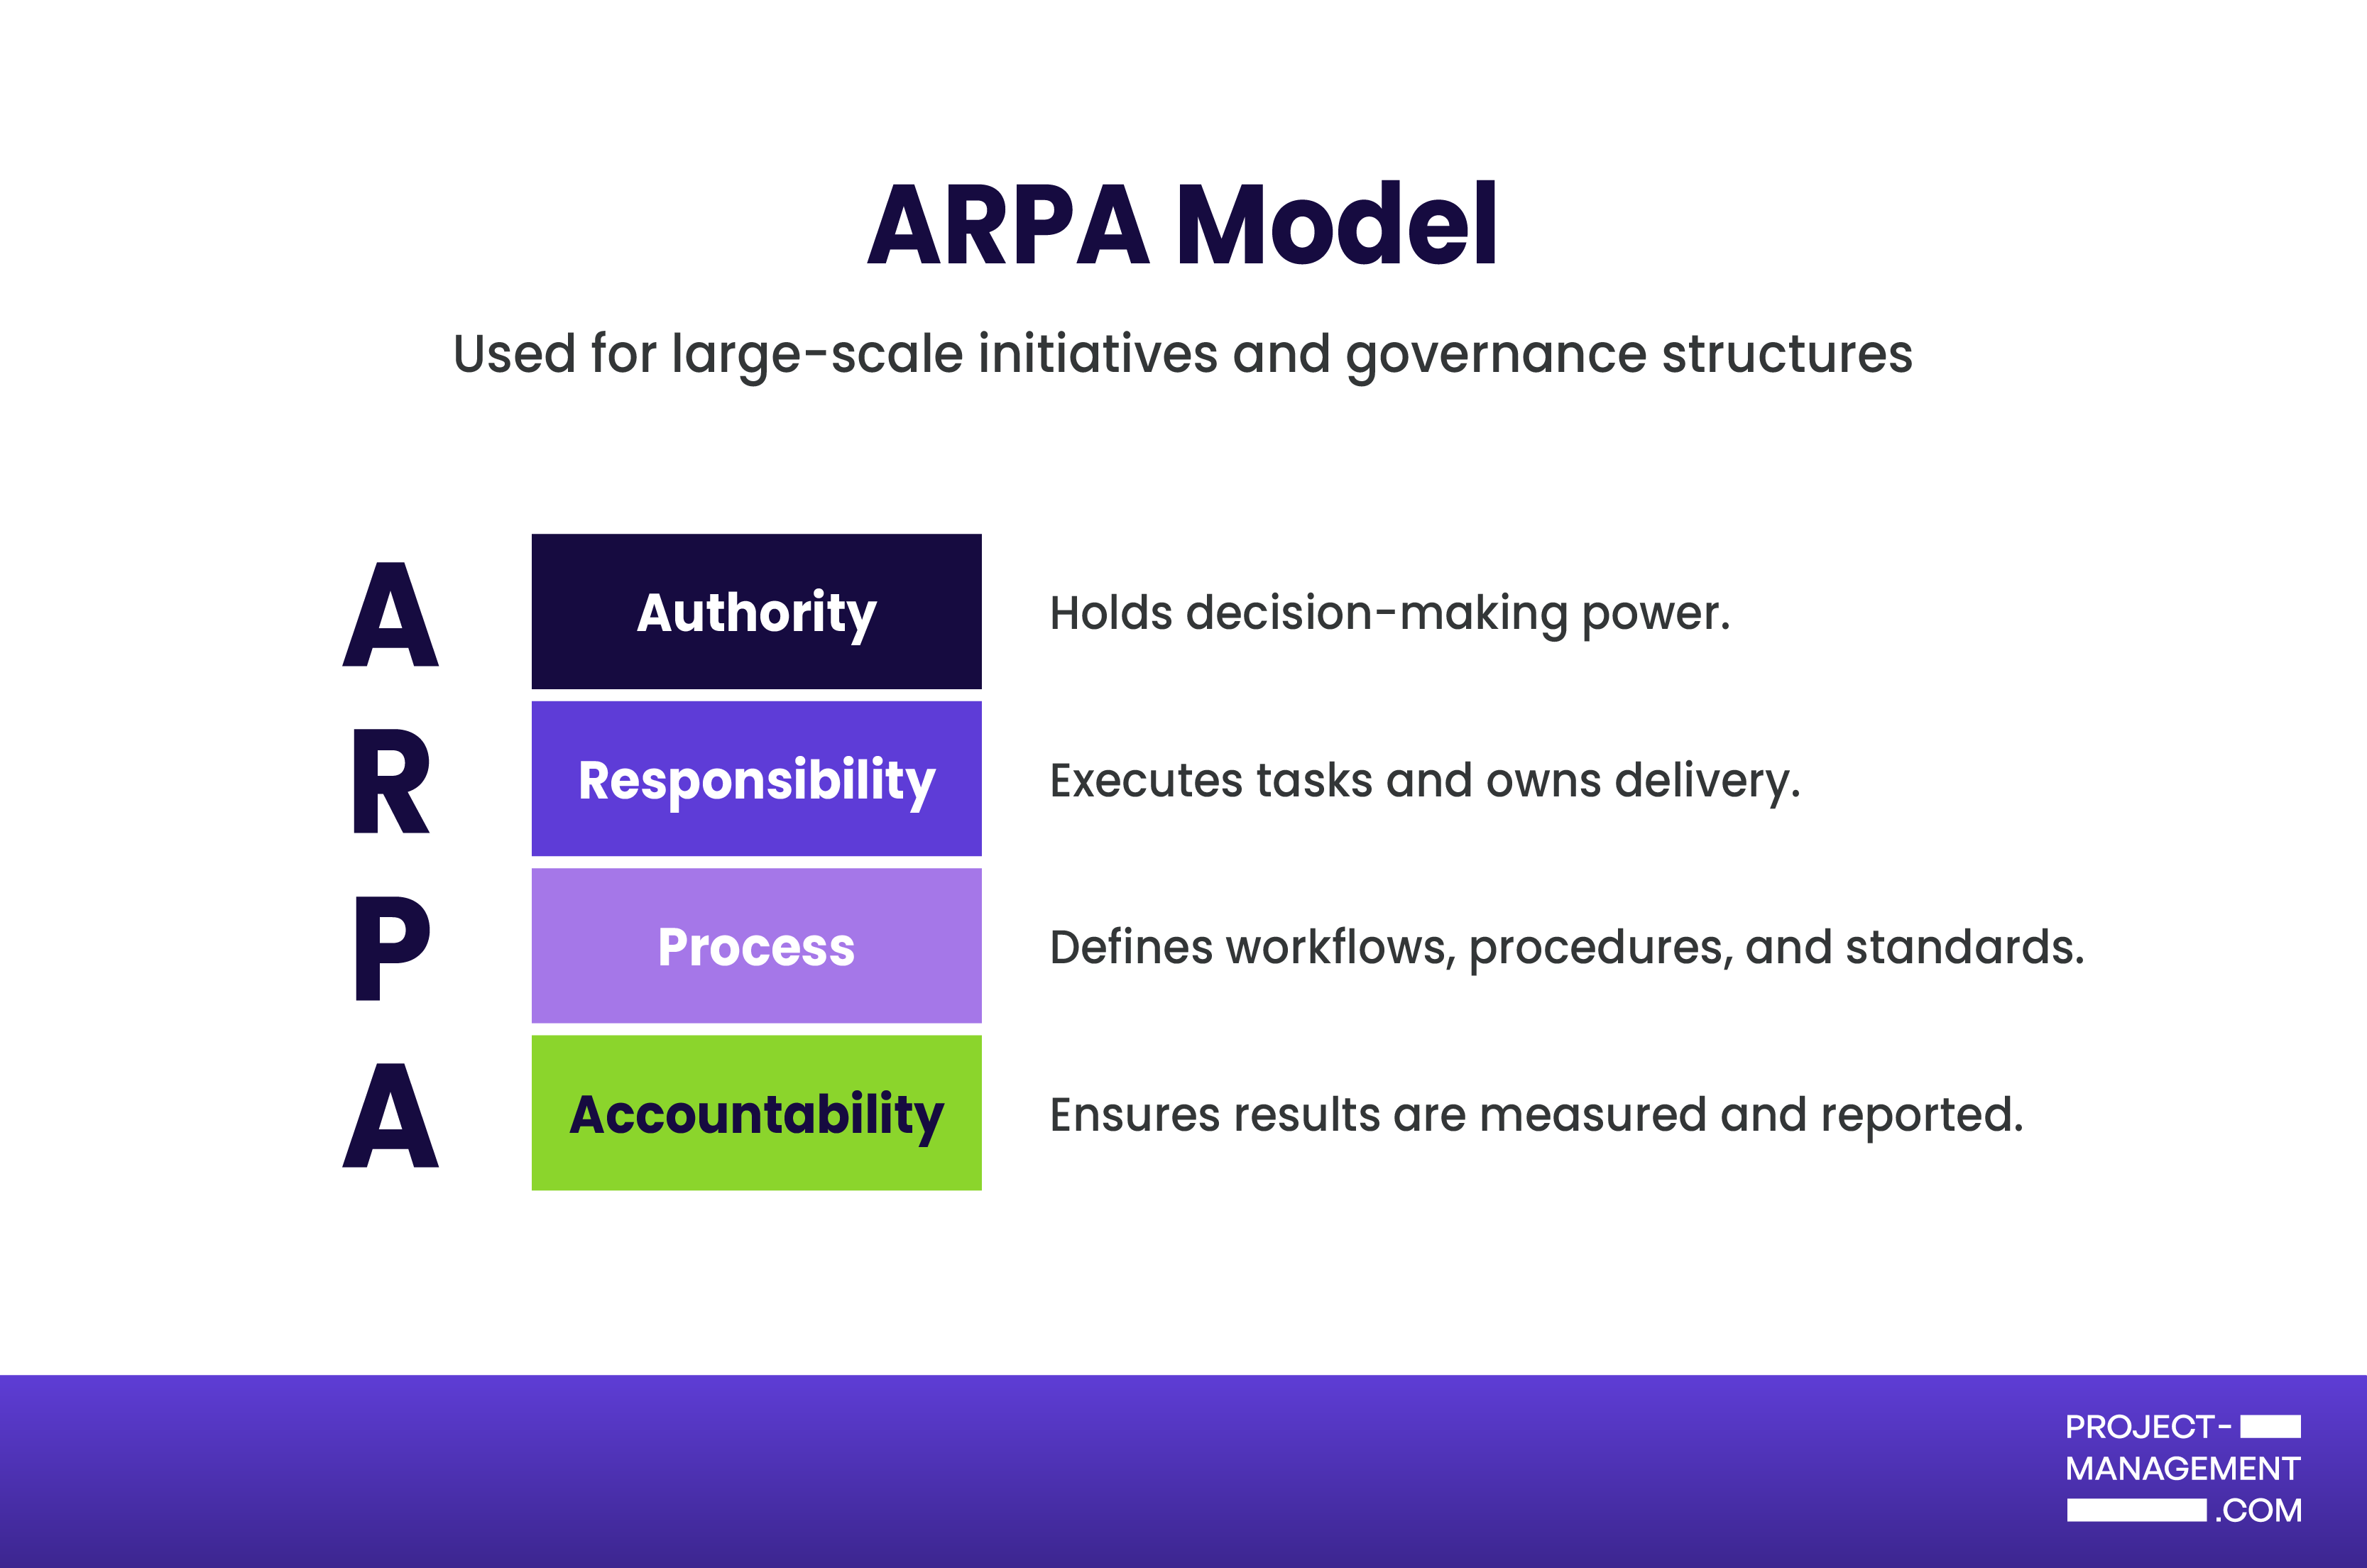
Real-life example of ARPA
For an enterprise ERP rollout, the steering committee holds Authority, the program manager has Responsibility for delivery, the PMO defines Process through stage gates, and internal audit ensures Accountability through metrics and reviews.
How to implement ARPA
- Define decision domains and where Authority resides.
- Assign Responsibility for outcomes to named owners.
- Document Process for planning, reviews, and escalations.
- Set Accountability measures, controls, and reporting cadence.
- Publish the framework in your workspace and train teams on how to apply it.
- Review governance effectiveness after each major milestone and refine as needed.
RACI alternatives compared
When RACI doesn’t fully capture the roles of your project, several alternatives offer more flexibility and detail. The table below compares popular RACI matrix alternatives like RASCI, DACI, RAPID, PACSI, and ARPA to help you choose the right fit.
| Model | RASCI | DACI | RAPID | PACSI | ARPA |
| Best use case | Projects needing extra support roles | Collaborative projects with shared accountability | Complex decision-making with multiple stakeholders | Quality control and risk management projects | Large initiatives requiring clear authority lines |
| Focus area | Role clarity with added “Support” function | Decision-making across drivers, approvers, contributors | Defines recommend, agree, perform, input, decide | Approval, stakeholder input, and control | Authority, responsibility, process, accountability |
| Complexity level | Low to moderate | Moderate | High | High | Moderate to high |
| Best for team size | Small to medium | Medium to large | Large, cross-functional | Medium to large teams with regulated tasks | Large teams and hierarchical orgs |
Each RACI alternative offers unique strengths depending on your project’s structure. In the following sections, I break down each model in detail so you can see how it works and when to use it effectively.
💡Want to expand your knowledge of core project management concepts? Check out this glossary of terms: Project Management Terms & Concepts
Which RACI alternative fits your project? Use these examples
Choosing the right alternative to RACI depends on the size, scope, and structure of your project. Here are common scenarios with the frameworks that work best.
- Small team project – RASCI
RASCI works best for small teams because it adds a Support role, making it clear who provides hands-on help. This keeps work balanced while ensuring accountability stays with one person. It’s simple enough for small groups but avoids the role overlap that often causes confusion.
- Cross-functional initiatives – DACI
DACI is ideal when multiple departments or stakeholders are involved in a project. The Driver keeps work moving, while the Approver ensures decisions are made on time. Contributors and Informed parties stay engaged without slowing down progress.
- Complex decision process – RAPID
RAPID provides structure when big, high-stakes decisions require multiple voices. By clarifying who Recommends, who must Agree, who gives Input, and who ultimately Decides, you avoid bottlenecks. This framework ensures decisions are made with the right mix of authority and expertise.
- Fast-moving agile projects – DACI
For agile work, DACI helps teams make decisions quickly without losing accountability. The Driver or Decider keeps momentum high, while contributors and approvers provide just enough oversight. This balance allows teams to adapt fast while staying aligned.
- Quality control projects – PACSI
PACSI is best for projects where compliance and risk management matter. With roles like Control and Suggest, the framework emphasizes checkpoints and expert review. It ensures deliverables meet standards before they move forward, making it a strong fit for regulated environments.
- Customer-facing rollouts – RASCI
When delivering a seamless customer experience is a top priority, RASCI helps ensure no role is overlooked. Support or Verifier/Signatory roles capture the extra care needed for client interactions and approvals. This structure reduces mistakes and improves confidence in the final rollout.
What are the factors to consider when choosing the right framework?
Selecting the right alternatives to the RACI matrix comes down to your project’s size, complexity, and goals. Each framework offers unique strengths that make it better suited for specific situations.
- Team size and structure: Smaller teams often benefit from simpler frameworks like RASCI, which keeps accountability clear while still allowing for support roles. Larger or cross-functional groups may need DACI or ARPA to manage decision rights across multiple departments.
- Decision-making needs: If your project requires frequent or high-stakes decisions, RAPID or DACI are better choices because they define who decides, who recommends, and who must agree. This helps avoid bottlenecks when too many people want a say.
- Regulatory or quality requirements: For projects where compliance, safety, or quality checks are critical, PACSI ensures control and approval steps are clearly defined. This makes it a strong fit for industries like healthcare, construction, or finance.
- Speed and agility: Agile projects or fast-moving teams benefit from DACI, since these models emphasize quick decision-making while maintaining accountability. They reduce red tape so you can adapt quickly without losing clarity.
- Stakeholder communication: If your project involves many stakeholders or external clients, frameworks like RASCI make sure everyone knows how they fit in. These models clarify who is informed and consulted so updates don’t fall through the cracks.
No single framework is right for every project, which is why understanding these alternatives matters. RASCI, DACI, RAPID, PACSI, and ARPA each provide structure that can match the unique demands of your work. By aligning the framework to your decision needs, you’ll boost collaboration and overall project success.
FAQs
RACI stands for Responsible, Accountable, Consulted, and Informed, and it’s a framework used to clarify roles in a project. RASCI is a variation that adds a Support role, making it clear who provides hands-on help to the person who is Responsible.
DACI stands for Driver, Approver, Contributor, and Informed, and it is used to streamline decision-making. It ensures one person drives the work forward while a single approver makes the final call.
RACI defines broad roles for responsibility and accountability in tasks, while DACI focuses specifically on decision-making. In DACI, the emphasis is on who drives, approves, and contributes to a decision, rather than just task execution.