


KEY TAKEAWAYS
Project metrics play a crucial role in evaluating the success and effectiveness of a project. As defined by the Project Management Institute, a project is a temporary endeavor aimed at creating a unique product, service, or result. By implementing project metrics, organizations can assess whether the resources and investments allocated to a project have generated the desired outcomes.
By defining project metrics early on, project managers can effectively monitor progress, identify potential issues, and make informed decisions to keep the project on track toward its desired outcomes.
What Are Project Management Metrics?
Metrics in project management are essential tools for measuring the progress and success of a project. These metrics are objectively measurable parameters that pertain to various aspects of the project. They play a major role in project control, allowing project managers to track and evaluate the project’s performance.
Traditionally, project metrics were focused solely on the success of project deliverables. However, over time, the outlook on project metrics has evolved. Now project metrics also consider the business impact of the project and sometimes even the operational impacts on the project team. This expanded perspective helps in understanding the overall effectiveness and value of the project.
It is crucial to define project metrics at the initial stages of a project. This allows for clear goals and expectations to be set and ensures that the necessary data is collected throughout the project lifecycle.
14 Types of Project Management Metrics
Schedule Variance
Schedule Variance (SV) = Earned Value (EV) – Planned Value (EV)
Schedule variance indicates how well the work is progressing against the project schedule. It helps project managers evaluate whether tasks are being completed on time or if there are delays that need to be addressed.
A positive schedule variance indicates that work is ahead of schedule, while a negative variance suggests that tasks are behind schedule.
Cost Variance
Cost Variance = Projected Cost – Actual Cost
Cost variance is a critical metric for measuring project success that focuses on evaluating the team’s ability to complete the work within or under budget. A negative result in cost variance indicates that the project has exceeded the anticipated budget. This can be a cause for concern as it signifies a potential financial risk and may require immediate attention to bring the project back on track. By closely monitoring cost variance, project managers can identify areas of overspending or inefficiencies and take corrective measures to ensure the project remains financially viable.
Human Resource Utilization
Resource Utilization = [(Number of scheduled hours) / (Number of available hours)] *100
Resource utilization measures the efficiency and productivity of a team. This metric provides valuable insights into how effectively resources are being utilized and whether there is any room for improvement.
A high resource utilization indicates that the team is fully engaged and making the most of their allocated time, while a low utilization may suggest that there are inefficiencies or bottlenecks in the workflow that need to be adjusted.
Earned Value (EV)
EV = Percent of Work Completed x Task Budget for Work Completion
Earned value, also referred to as budgeted cost of work scheduled (BCWS), represents the value of the work that has been completed or the value that has been produced. This value is calculated by multiplying the actual percentage of completion by the budget allocated for the task.
Productivity
Productivity = Total Input/Total Output
Productivity provides insights into how efficiently resources are being utilized and the effectiveness of its operations. The variables for “input” and “output” can vary, depending on the project. If you’re in manufacturing, for example, and you generate $100,000 worth of goods with 1,000 labor hours, it means that your productivity is $100 per hour. The factors could be different for sales, real estate, marketing, and others.
Cost Performance Index
CPI = Earned Value / Actual Costs
In project management terms, the cost performance index (CPI) represents the value obtained for every dollar spent on a project. A CPI greater than 1 indicates that the project is performing well in terms of cost, as the earned value is higher than the actual costs. On the other hand, a CPI less than 1 suggests that the project is over budget.
Quality Metrics
Specific quality metrics used will vary depending on the nature of the project. For example, in a software development project, quality metrics may include the number of defects found during testing or the customer satisfaction rating. In a manufacturing project, quality metrics may focus on the number of defective units produced or the adherence to product specifications.
By tracking and analyzing these metrics, project managers can ensure that the project meets quality standards and take corrective actions if necessary.
Customer Satisfaction Index
Customer Satisfaction Score = [(Total Survey Score / Number of Questions)] x100
Measuring customer satisfaction is crucial for businesses to understand their performance and identify areas for improvement. One commonly used method is the customer satisfaction score (CSS), which is calculated by dividing the total point score from a survey sheet by the number of questions and multiplying it by 100. This provides a percentage that represents the level of satisfaction among customers.
Alternatively, the net promoter score (NPS) can also measure the customer satisfaction index. NPS is determined by asking customers how likely they are to recommend a product or service to others on a scale of 0–10. By utilizing these metrics, businesses can assess customer satisfaction and make informed decisions to enhance their products and services.
Number of Issues Raised Since Live Release
One way to measure the success of a project is by assessing the number of issues raised since its live release. A high number of issues raised after the live release suggests that there may be unresolved problems or deficiencies in the project’s implementation or functionality. On the other hand, a low number of issues raised indicates a well-executed project that meets user requirements and has been thoroughly tested prior to release.
A high number of unresolved issues could be a reason for project failure, so by monitoring and addressing them promptly, we can ensure that the project continues to deliver the desired outcomes and remains successful in the long run.
Process Improvement
When a project is undertaken, it is done to bring about positive changes and advancements within the organization. Therefore, evaluating the impact of the project on the company’s processes is crucial in determining its success. If the project has successfully streamlined workflows, enhanced efficiency, and optimized operations, it can be considered a successful endeavor. Improved processes can lead to increased productivity and reduced costs, and ultimately contribute to the overall growth and success of the company.
Gross Profit Margin
GPM % = (Gross Profit/Revenue) x 100
Gross profit margin measures the profitability of a company. This percentage indicates how much profit a company generates from its sales after deducting the cost of goods sold.
As a rule of thumb, a gross profit margin of 20% or higher is considered profitable, while a margin between 10% and 20% is considered average. A higher gross profit margin indicates that a company is able to generate more profit from its sales, which can be a positive sign for potential investors. Conversely, a lower margin may indicate that a company is struggling to control its costs or facing pricing pressure in the market.
Return on Investment
ROI = (Net Benefits/Cost) * 100 (Source: Cella Inc)
Return on investment (ROI) assesses the profitability and success of a project. It measures how the costs incurred for completing a project compare to the net benefits obtained from it. A higher ROI indicates a more favorable outcome, as it implies that the net benefits outweigh the costs.
Organizations use ROI as a decision-making tool to evaluate the feasibility and potential of various projects before committing resources to them. By analyzing ROI, businesses can make informed decisions and allocate their resources effectively to achieve maximum profitability.
Competitive Advantage Gained
The competitive advantage refers to the unique benefits or advantages that the completion of the project has provided to the client. It could be in the form of cost savings that would allow the company to offer their products or services at a lower price point, or enhanced product quality or new features that allow them to have an edge over their competitors.
Opportunities Identified
Another metric that can identify the success or failure of the project is the opportunities it enabled its stakeholders to discover. For example, for sales events, it’s likely that project success metrics would include the number of leads generated and the number of sales closed. But aside from actual sales revenue generated during a sales event, the buzz the project generated during its promotion may have also attracted potential collaborations for the client. Considering opportunities that the event helped come to light would also be good to consider when evaluating project success and in making decisions for future similar endeavors.
Metrics vs KPIs
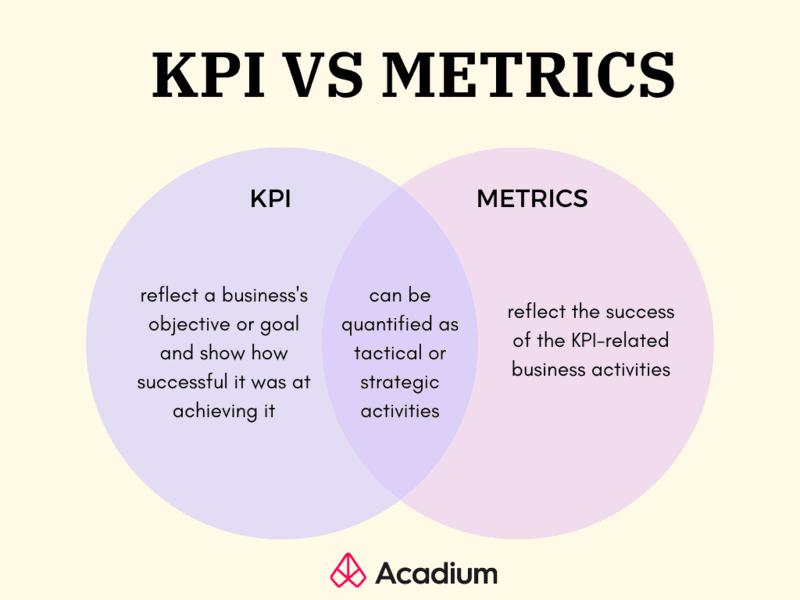
Project success metrics and project KPIs are both essential tools for assessing the progress and performance of a project. Project KPIs provide a high-level view of the overall success of the project, focusing on the achievement of objectives and goals. These help all key project stakeholders understand whether the project has met its intended outcomes and if it has delivered value.
On the other hand, project metrics are more specific measurements that track the progress and performance of individual activities or processes within the project. They are usually tactical in nature. These enable project managers to monitor the execution of the project, identify any issues or bottlenecks, and take corrective actions to ensure that the project stays on track.
For example, the business KPI could be to increase profit by a certain percentage. The related project metrics a sales event organizer could have would be the number of guests who showed up, the net promoter scores given by the attendees through an event survey, and the return on investment comparing the revenue generated and the cost of the whole event.
By comparing project metrics with project KPIs, organizations can gain valuable insights into both the overall success of the project and the performance of its individual components.
What Makes a Successful Project?
A successful project is not only determined by its completion within the given time and budget, but also by the positive impact it has on various aspects of the organization.
One crucial aspect is the project team. A successful project boosts the morale and motivation of the team members, as they see their hard work and efforts paying off. It enhances their skills and knowledge, making them more valuable assets for the company.
Moreover, a successful project brings recognition to the company, enhancing its reputation and credibility in the industry. It showcases the company’s ability to deliver quality results and meet client expectations.
Finally, a successful project can have a significant impact on the business itself. It may lead to increased revenue, improved customer satisfaction, or expanded market share.
Bottom Line
Project success metrics play a vital role in quantifying and measuring these impacts. These metrics provide concrete data that can be used to evaluate the project’s success and identify areas for improvement in future projects. By analyzing these metrics, project managers can make informed decisions and implement necessary changes to maximize the positive impact of their projects on the team, company, and business as a whole.