


Key takeaways
Measuring success in project management is complex because stakeholders often define it differently, depending on priorities and expectations. A project can meet its schedule and budget targets yet still fall short if it fails to achieve its objectives. This article explains the fundamentals of measuring success in projects, then walks you through using the right metrics and tools.
What does “measuring success” mean in project management?
Measuring success means evaluating how well a project meets its objectives and delivers value to the organization or client. It involves comparing what was planned against what was achieved, such as whether deliverables met quality expectations and stayed within scope and budget.
It also examines how effectively the project met stakeholder needs (e.g., determining if the solution solved the problem it was meant to address or improved team productivity). By assessing outcomes against these standards, project managers can identify what worked and what caused setbacks.
Project success criteria examples
Project success criteria define what successful delivery looks like. These examples show how performance can be evaluated objectively:
- Schedule performance: Completion within planned deadlines and milestone dates.
- Budget control: Total project cost stays within the approved budget range.
- Quality achievement: Deliverables meet the required standards or pass acceptance testing.
- Stakeholder satisfaction: End users confirm that deliverables meet their expectations.
- Business value: The project delivers measurable outcomes, such as increased revenue, cost savings, or efficiency gains.
- Team performance: Productivity and workload remain balanced throughout the project cycle.
Key metrics used to measure project success
Learning what success measurement to use is one way to evaluate project outcomes. The sections below group commonly used metrics by category, with tables that explain what each metric tracks.
Schedule metrics
Schedule metrics show whether the project progressed according to the approved timeline. Schedule variance compares planned completion dates with actual results to identify tasks completed earlier or later than expected, while the schedule performance index indicates how efficiently time was used relative to the original plan.
| Metric | Description | Best for |
|---|---|---|
| On-Time Delivery | Tracks if milestones and final outputs are completed based on deadlines. | Evaluating timeliness and identifying schedule delays. |
| Schedule Variance (SV) | Schedule variance measures the difference between planned completion dates and actual finish dates to determine if the project is ahead or behind schedule. | Monitoring project timeline performance. |
| Schedule Performance Index (SPI) | Measures time efficiency by dividing earned value by planned value, showing how closely actual progress follows the project schedule. | Tracking schedule efficiency and forecasting timeline risks. |
| Cycle time | Measures the time it takes to complete a specific task or deliverable from start to finish. | Identifying workflow bottlenecks and improving process speed. |
Cost performance
Cost metrics determine how well the project spending stayed within the approved budget. Cost variance shows whether the project overspent or underspent, and cost performance index indicates how effectively budgeted funds were converted into completed work.
| Metric | Description | Best For |
|---|---|---|
| Cost variance (CV) | Measures the difference between the budgeted cost and the actual cost of completed work. | Assessing cost control effectiveness. |
| Cost performance index (CPI) | Calculates the efficiency of budget use by dividing earned value by actual cost. | Tracking financial efficiency and cost forecasting. |
Scope and quality metrics
These metrics assess whether the project delivered the agreed requirements at an acceptable standard. Scope change frequency tracks how often requirements are shifted after approval, while defect rates or rework levels indicate how much delivered work failed to meet acceptance criteria.
| Metric | Description | Best for |
|---|---|---|
| Defect density | Counts the number of issues found per deliverable or unit of work. | Evaluating product or deliverable quality. |
| Rework rate | Measures how much work required correction or revision after delivery. | Identifying gaps in requirements and quality assurance. |
| Scope change frequency | Tracks the approved scope changes during execution. Frequent changes indicate unclear requirements or evolving priorities. | Managing scope stability and controlling scope creep. |
Stakeholder satisfaction
Satisfaction metrics capture how stakeholders perceive the project outcome. Survey scores, formal sign-offs, or post-delivery feedback show whether expectations were met and whether the delivered solution addressed the problem.
| Metric | Description | Best for |
|---|---|---|
| Stakeholder satisfaction score | Collects feedback from sponsors, clients, or end users to gauge outcome satisfaction. | Measuring how well expectations and needs were met. |
| Team morale index | Uses survey data or productivity indicators to assess engagement and workload balance. | Maintaining team performance and preventing burnout. |
Business value metrics
Business metrics evaluate the impact of the project after delivery. Examples include return on investment, cost savings achieved, or productivity improvements compared to the pre-project baseline, which demonstrate whether the project justified its investment.
| Metric | Description | Best for |
|---|---|---|
| Return on investment (ROI) | Compares project benefits or savings to the total cost of delivery. | Evaluating the financial return from project outcomes. |
| Benefit realization rate | Compares actual benefits achieved against those defined in the business case. | Tracking long-term strategic value and goal achievement. |
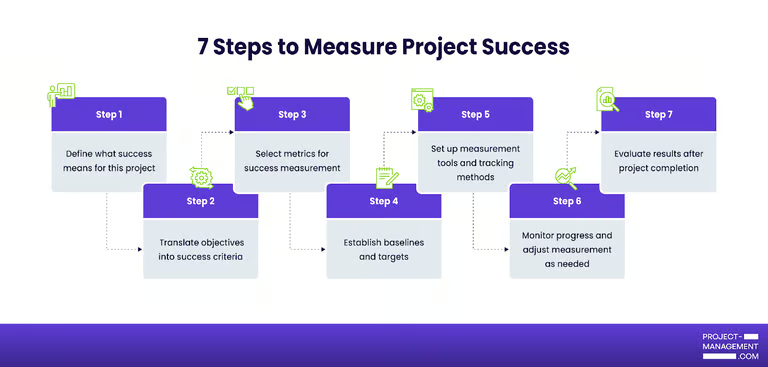
How to measure project success in 7 steps
The steps in measuring project success involve defining objectives, selecting success criteria, and setting up measurement tools that reflect how the project is expected to perform. Each step ensures that results can be tracked accurately and that progress connects directly to project goals.
Step 1: Define what success means for the project
Begin by identifying what the project aims to achieve. Success may mean delivering a system that reduces customer response time or launching a product that meets revenue targets. This definition sets the standard for evaluation and prevents confusion about what outcomes should be achieved.
Step 2: Translate objectives into success criteria
Convert broad objectives into measurable outcomes. For instance, if the goal is to improve service efficiency, success criteria might include resolving 90% of support tickets within one business day or reducing downtime by half. These project success criteria provide a quantifiable basis for judgment.
Step 3: Select metrics for success measurement
Identify the metrics that demonstrate whether each success criterion was met. Examples include cost variance to measure budget performance or stakeholder satisfaction scores to gauge value perception. Each factor should represent an observable change or condition, not a general assumption of success.
Step 4: Establish baselines and targets
Set reference points that define starting conditions and the desired end state. A baseline might be the current average cycle time of a process, while the target defines the improvement goal. This comparison allows project managers to see how much progress has occurred and where further effort is needed.
Step 5: Set up measurement tools and tracking methods
Decide how progress data will be captured and reviewed during execution. You can implement tools that collect and analyze performance data, such as project management apps for task tracking or survey tools for stakeholder feedback.
Step 6: Monitor progress and adjust measurement as needed
Review results regularly and ensure each metric still reflects the project’s priorities. When change requests or scope adjustments affect timelines, costs, or deliverables, success metrics and baselines should be formally re-baselined to maintain accurate and fair performance measurement. This ensures results reflect the current project reality rather than outdated assumptions.
Step 7: Evaluate results after project completion
Compare final outcomes with initial criteria and baselines. Review performance reports, financial results, and stakeholder feedback to determine which goals were met and which fell short. A post-project evaluation informs better planning for future projects and strengthens performance management across the portfolio.
Best tools for tracking project success
Now that you’ve determined which metrics to track, the next step is to select a tool that captures data throughout the project lifecycle. Project management platforms are ideal for this purpose because they centralize tracking and reporting, allowing teams to measure progress and evaluate performance in one environment.
monday work management: Best for data visualization
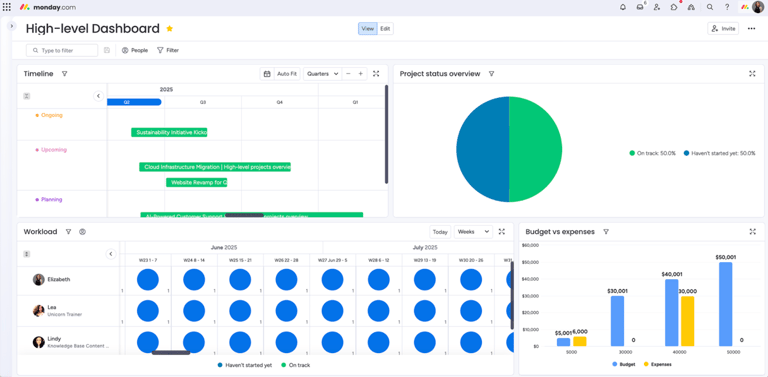
monday works best for measuring project success because it uses different interactive elements to visually track the progress of all your ongoing projects. Reporting tools such as charts, dashboards, and widgets reveal progress, budget status, and workload in one view. You can calculate planned versus actual spend with formula columns and display the results in charts to determine if the projects exceeded budget limits.
ClickUp: Best for task tracking
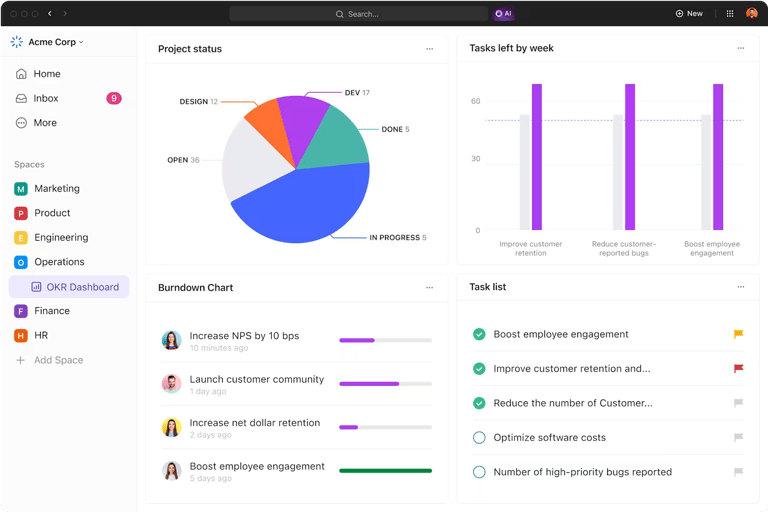
ClickUp’s AI-driven task management platform includes a built-in feature for tracking project success and team goals. It connects objectives to individual tasks and updates progress automatically as work is completed. Teams can set task targets or numerical goals to record completion totals, percentages, or fixed outcomes, while managers can organize goals into folders for sprint cycles or OKRs to compare progress and pinpoint lagging objectives.
Jira: Best for Agile reporting
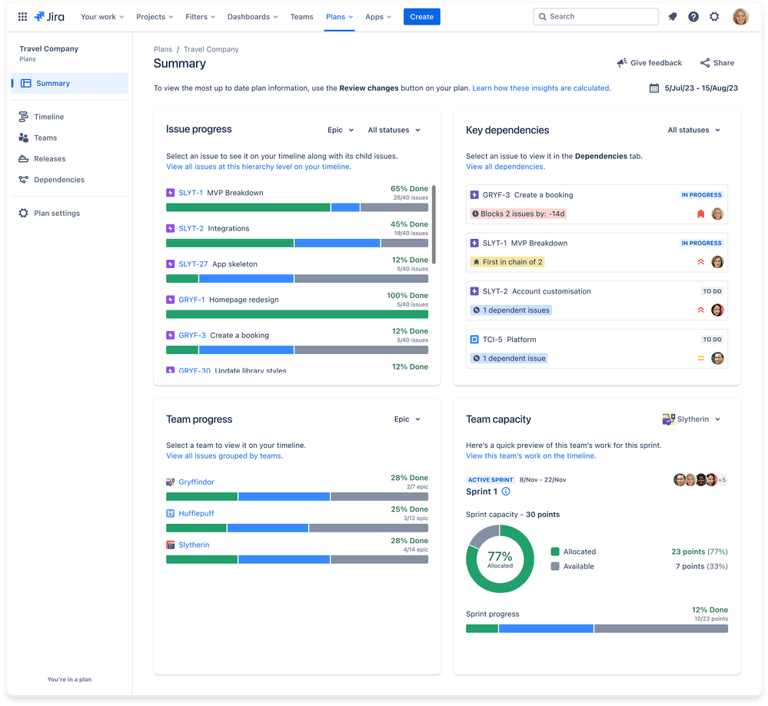
Jira is well-suited for agile reporting because its built-in reports track sprint progress and scope changes using issue data, which allows teams to compare planned work against completed work. Reports such as burndown, burnup, and velocity charts display time-based performance trends, helping teams forecast delivery and detect scope or workflow problems.
This reporting model supports measuring project success by tying delivery outcomes directly to sprint goals and historical performance, which teams use to assess predictability and improve future planning.
Common mistakes when measuring project success + best practices
Beyond selecting the right project success metrics and tools, understanding common pitfalls can improve how you measure project outcomes. Successful measurement depends on setting clear objectives, maintaining accurate data, and involving stakeholders in assessing results.
Following these practices helps teams measure performance accurately and make adjustments that strengthen outcomes throughout delivery.
- Defining success only by delivery: Treating a project as successful solely because it was completed on time or within budget ignores whether the delivered output solved the intended problem. Define success in terms of outcomes, such as whether the project reduced processing time or enabled a new capability that stakeholders agreed was needed.
- Setting objectives that cannot be evaluated: Using broad objectives like “improve efficiency” makes it difficult to assess results at project close. Success measurement improves when objectives are translated into observable conditions, such as a higher customer satisfaction rate and a decrease in handoff delays.
- Ignoring stakeholder expectations: A project may meet targeted success metrics and KPIs but still fall short if stakeholder needs are not addressed. Regularly collect feedback from sponsors or end users to compare outcomes against their goals.
- Using inconsistent or outdated data: Relying on data that isn’t regularly updated distorts performance tracking. Use tools like project management platforms, as they feature automated reporting tools to reflect real-time status.
- Reviewing success only at project close: Waiting until the end to measure performance eliminates the chance to correct issues during execution. Evaluate measurement data at scheduled intervals, so teams can detect performance gaps early enough to take corrective action.
FAQs
Why is it so important to measure success?
Measuring success shows whether a project achieved its intended goals. It helps teams confirm that outputs, such as deliverables or service improvements, met the objectives set during planning and provides data to guide future project decisions.
What is the best way to measure project success?
Define success criteria, then track performance through metrics like budget adherence, delivery time, and stakeholder satisfaction. Compare actual results with initial targets to determine if the project met its goals.
How do you measure success in Agile projects?
Agile success is measured by tracking delivered value over time, not just sprint completion. Teams review completed work against sprint goals, assess how outcomes affected users or processes, and use historical data such as velocity trends to evaluate predictability and improvement over multiple iterations.