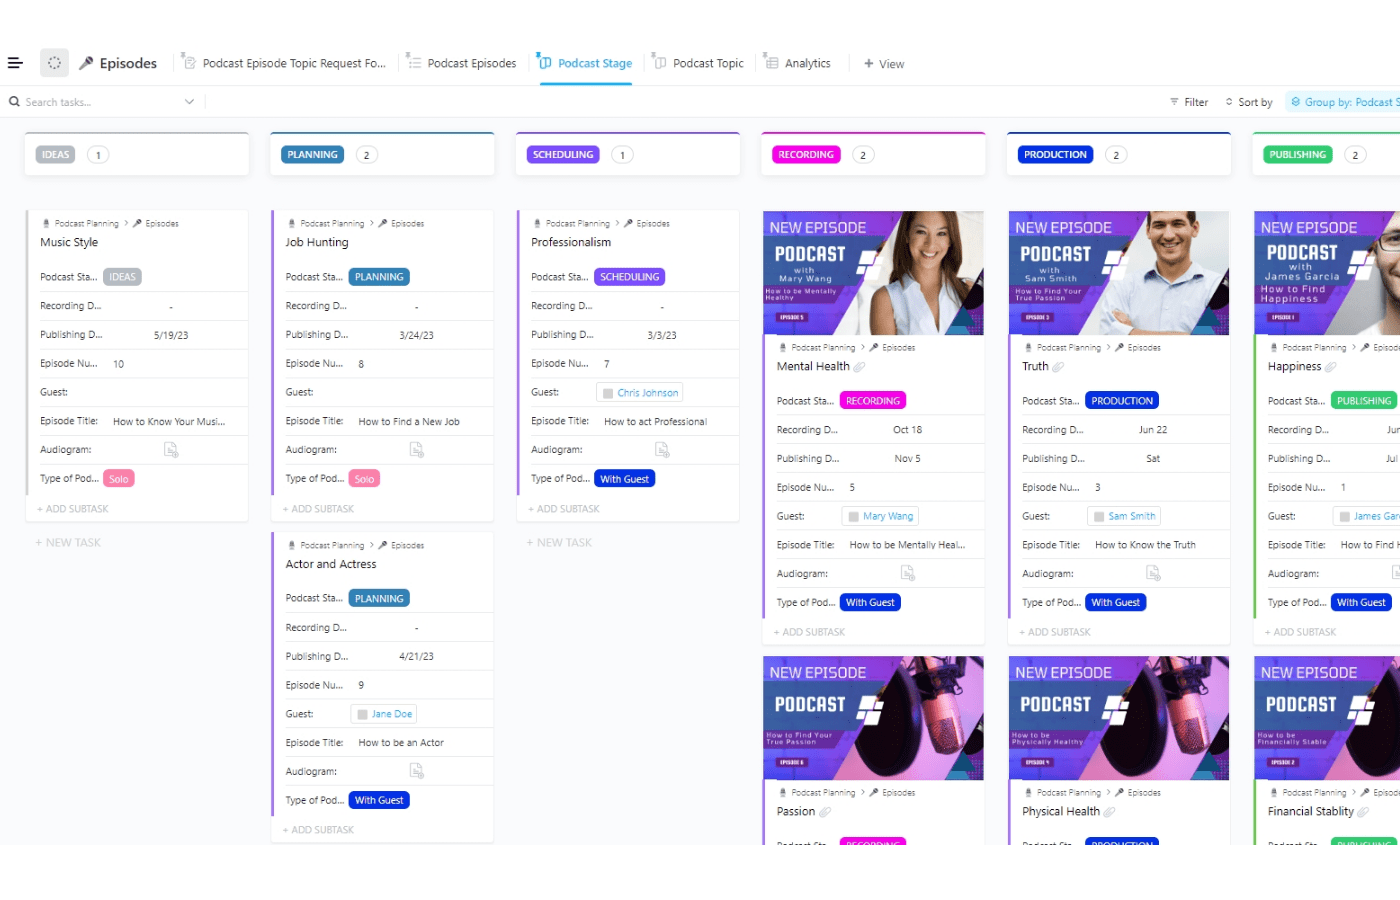
Decision-making is one of the key responsibilities of a project manager. To make good decisions, you need insights derived from data and trends. And there are few tools better at helping make sense of the data set than dashboards.
Dashboards are visualization tools that give organized information (usually from different sources) compiled in one point of access. By extracting, monitoring, and analyzing data, dashboards allow decision-makers to form actionable insights to improve their projects.
Types of Project Dashboards
Strategic dashboard
Strategic dashboards allow upper management to see the company’s or team’s performance through their key metrics. For example, sales directors might want to monitor the team’s total revenue and the number of customers. A software product manager can monitor the number of users, revenue, and retention.
Information on a strategic dashboard can allow management to compare performance in previous time frames and come up with a data-driven direction for their teams.
Operational dashboard
Operational dashboards are used to monitor the efficiency of the team’s efforts. For example, a manufacturing company’s operational dashboard may display the number of products packed or produced in real time. This way, supervisors and managers can spot abnormalities if there are any, and action can be taken right away to address them.
Tactical dashboard
Tactical dashboards sit between strategic dashboards and operational dashboards when it comes to purpose and level of detail.
An example of a tactical dashboard is one that displays the performance of social media pages. Social media managers would monitor this to understand which posts work and which don’t. This will grant them insight into what they can do more to create more engagement in their channels.
Tactical dashboards are often used by middle managers to monitor real-time performance and determine if adjustments need to be done in how they execute their plans.
Analytical dashboard
Analytical dashboards are incredibly detailed. Used by analysts, these dashboards assist experts in spotting trends and predicting possible scenarios the company needs to prepare for.
For example, a dashboard that displays a company’s costs and revenues can help analysts make projections on how profitable they’ll be in the next few years. This information can be used to pitch for investors or partners or for management to initiate major adjustments in case projections look dire.
Need help building out the perfect dashboards? Check out our listing of the best dashboard builders for project managers. | project-management.com
Key Features for Project Dashboard Software
Manually managing dashboards can be incredibly taxing. If you need real-time information, it might even be downright impossible. To maximize the benefits of project dashboards, it is highly recommended to adopt
good project dashboard software.
Here are key features to look for when picking the best one.
Relevant integrations
Integrations are what allow a project dashboard software to extract information from the sources you need. Before picking a software, think about your team’s KPIs and what you’re using to track them. Then, look through your options and ensure they have those integrations available.
Visualization options
Dashboards help gather vast amounts of information in a shorter amount of time because of how they display information. To maximize your project dashboard software, pick one that provides several options on how it displays the data you need. This flexibility will allow you to choose the format that you need for various situations.
Real-time data
Certain dashboards, such as operational and tactical ones, need real-time information to be effective.
Think about your purpose for the dashboard to determine how often you need the latest information. If you’re okay with weekly or monthly reviews, then perhaps real-time data processing may not be a priority. But if you want to be able to make urgent adjustments the moment the need arises, we’d recommend you invest in a project dashboard software that gives you insight in real time.
Customizability
Project dashboard software doesn’t just help your team stay on top of performance. It can also make it easier to align with project stakeholders.
Depending on what they do, stakeholders would want to see different sets of information. Customizability options such as filters let you create dashboards that prioritize the most important data, so people can monitor them without distraction.
Sharing and export options
Sharing information with clients can be easier when using project dashboard software equipped with export options. Whether it’s an option to share through a link or export reports as documents, spreadsheets, or PDFs, sharing and export options equipped with customizability will make you more efficient in creating performance reports.
Ease of use
For any tool or software, ensure the time you use to configure them isn’t making you or your team unproductive at work. While making adjustments upfront is normal, constantly stressing over how to use them can be counter-productive to your team’s efficiency.
An intuitive interface, sound helpdesk, and a clear onboarding process can go a long way in making your project dashboard software usable for everyone.
Building Actionable Dashboards
To create dashboards that allow you to improve your direction and efficiency, ask yourself the right questions before you start making them.
What is the purpose of this dashboard and who will use it?
Think about your stakeholders. What pieces of information are important for them to monitor? What are their KPIs? Overwhelming them with unnecessary information will only distract them from the work they need. Align on metrics that each stakeholder needs, so you can craft customized dashboards that they will truly find useful.
What are relevant metrics to include?
With sophisticated analytics software available, you can generate hundreds of data points with just a few clicks. However, when picking metrics to monitor, it’s important to identify which ones truly help move the needle.
This may change depending on your team’s current priorities. When you’re creating a dashboard, be sure you’re displaying the ones that are crucial to your goals and objectives.
What relationships and trends need to be observed?
Identifying trends and relationships can spell breakthroughs for many businesses. For example, identifying what marketing channels drive revenue can help you allocate your marketing budget most effectively. Seeing the relationship between specific efforts will give you insight into your customers’ buying behaviors and preferences.
Think about the relationships you want to observe and include them in your project dashboard.
Stay on Top of Your Projects
Project dashboards done right can help you stay on top of your projects and communicate them with relevant stakeholders. Having a good view of relevant metrics will help you gain good insight which will lead to better direction and decisions. And the best way to do that is to use project dashboard software to manage multiple data points and see them all in one place.
 Decision-making is one of the key responsibilities of a project manager. To make good decisions, you need insights derived from data and trends. And there are few tools better at helping make sense of the data set than dashboards.
Dashboards are visualization tools that give organized information (usually from different sources) compiled in one point of access. By extracting, monitoring, and analyzing data, dashboards allow decision-makers to form actionable insights to improve their projects.


