


KEY TAKEAWAYS
In the ever-evolving landscape of project management, understanding and mitigating risks stands as a cornerstone. But before risks can be addressed, there need to be effective risk identification techniques in place to help determine the problems the project may encounter.
In this article, we will talk about one of the most commonly used methods of identifying risks: diagramming.
Using Diagrams to Identify Risks
Diagramming risks is a fast and powerful technique to fully flesh out risks, both potential and actual, and an essential first step to risk management. Let’s break down three diagramming techniques often employed in project management as useful methods to identify risks.
Ishikawa Diagram
The Ishikawa diagram, affectionately known as the fishbone diagram, owes its origin to Kaoru Ishikawa in 1968. Picture a fish skeleton: the main issue (or effect) resides at the head, while branches extend, representing potential causes. This visual tool illustrates causal relationships—connecting various factors contributing to a specific problem or outcome. While its roots lie in quality defect prevention, it’s equally adept at risk identification. Peel back successive layers to reveal root causes of risks, empowering teams to devise targeted solutions and mitigate them.
Beyond quality management, its utility extends to risk assessment, thanks to its reliance on root cause analysis. Originally tailored for the manufacturing industry, it dissects causes across categories: Machine, Method, Material, Man Power, Measurement, and Environment—each harboring its own subcategories. These categories serve as compass points during brainstorming sessions, and serve as a guide us toward risk enlightenment.
Example of a Ishikawa Diagram
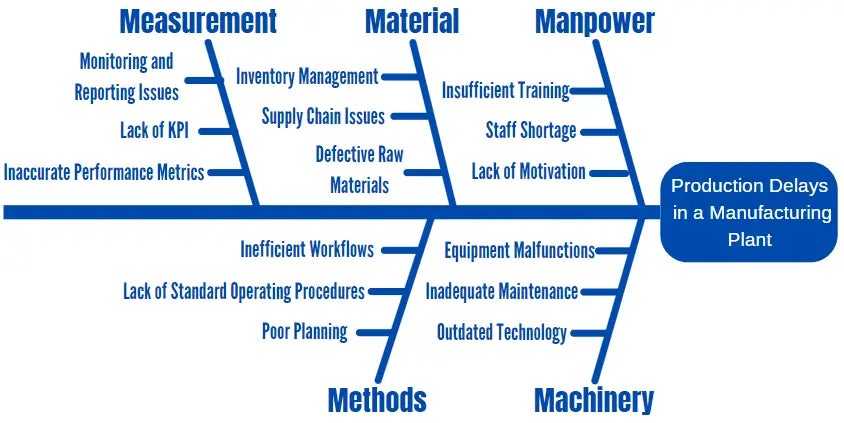
In the example above, under the “Machinery” category, you will find identified three issues pertaining to machinery that can cause production delays.
How to use the Ishikawa diagram
You can create and use the Ishikawa Diagram in five easy steps:
- Identify the problem: Begin by defining and writing down the problem that needs to be addressed.
- Brainstorm all categories of causes: Gather your team and identify all major categories of causes that relate to the problem.
- Categorize causes: Break out the details of each category into physical and non-physical materials and items, methods of process, machine and equipment assets, and measurement tools and methods, etc.
- Analyze impact: Identify and organize the identified causes into categories so you can view the big picture and visualize how different factors contribute to the problem and their potential impact on the success of project as a whole and know where you will focus your efforts for improvement.
- Create the diagram: Draw the Ishikawa diagram to resemble a fishbone with the problem statement at the head and the categorized causes as branches or vertical lines off the spine of the fish and label each one at the top. Add specific items to each cause as individual lines off of those branches represented by horizontal lines. Add additional information such as numbers, skews, or additional details as vertical lines off of each sub-category cause and so on.
Process Flow Diagram (Systems Diagram)
The process flow diagram (PFD), also known as a systems diagram, is a graphical representation used to describe and document the sequence of steps, decisions, pathways within a process, and relationships between the major components and processes in a system. Most commonly used in chemical and industrial engineering and software development to help display the relationship between major pieces of equipment and the general flow of processes, the PFD is also very helpful in identifying risks.
PFDs map out the journey of a specific process or system, illustrating how various inputs such as materials, energy, or data transform into outputs such as products, services, or results. They use symbols (such as rectangles for tasks, diamonds for decisions, and arrows for flow) to represent the flow of activities. This visualization aids in identifying inefficiencies, redundancies, and critical stages. The key to using the PFD is to have someone who actually performs the operation diagram the process. This will help ensure that nothing crucial to the process is left out. These diagrams help project managers understand the process, identify bottlenecks, and optimize efficiency.
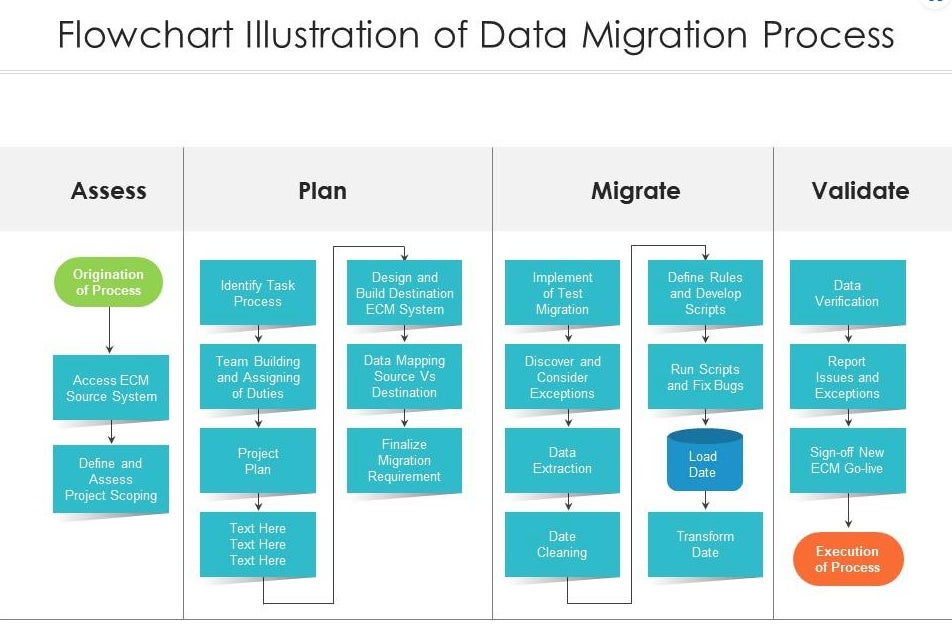
Example of a Process Flow Diagram
Below is an example of a PFD used to diagram a data migration process. This is a flow chart layout. You can also use a decision tree built into a PFD that allows you to address questions with a yes and no variable. This is one of the most useful aspects of the PFD for diagramming what happens when an identified risk takes place as you can map out a solution.
How to use the process flow diagram
Use the following steps to define and communicate the nuances of your process, enhancing understanding and serving as a tool for documentation and a roadmap for process improvement and troubleshooting.
- Define the process or system: Clearly identify the system or process you want to map out and define the scope and boundaries of the process you intend to diagram. Determine the starting point, end point, and the level of detail required.
- Gather necessary information and requirements: Collect all relevant data from experts and stakeholders about the system or process to avoid gaps in information, including the steps involved, inputs, outputs, decision points, resources needed, time taken for each step, and any dependencies.
- Define and list the steps or stages involved: Break down the process into specific and individual steps or stages with an effort to be clear and concise.
- Choose the right symbols and labels: Decide on the set of standard symbols (rectangles, diamonds, arrows, etc.) and labels you will use to represent different elements. Common process flow diagram symbols include ovals for start/end points, rectangles for process steps, diamonds for decision points, and arrows for the flow direction.
- Sketch the diagram: When creating your diagram, begin with the initial input. Then systematically map out each step in the process, leading toward the final output, using the selected symbols to maintain a clear, logical, and straightforward flow.
- Verify and validate the diagram with stakeholders: Once your diagram is complete, review it with key stakeholders to validate its accuracy. Feedback may lead to revisions for clarity or completeness, so it can be used to explain processes to clients, vendors, other stakeholders, or project team members.
Influence Diagram
An influence diagram is a detective-style tool for analyzing decision problems and summarizing critical details from a decision tree. They illustrate a decision problem with nodes denoting the decisions, objectives, chance variables, general variables, and their mutual influences. The directional arrows show influence, showcasing how one element affects another, through a visual depiction of causality. Unlike decision trees, influence diagrams circumvent the exponential growth issue, making them more manageable. They facilitate collaborative problem-solving by accommodating incomplete information sharing among team members.
The influence diagram is great for pinpointing types of risks that directly impact desired outcomes. Risks inherent in general variables, situations, or environments, as well as chance variables, can be readily identified through these diagrams. What sets influence diagrams apart is their remarkable speed in diagramming and risk identification. The simplicity of the influence diagram allows for a quick high-level conceptualization that is hard for other techniques to match.
Example of an Influence Diagram
Influence diagrams in business are useful for many scenarios including strategic decision-making, risk assessment and mitigation, resource allocation, project management, scenario analysis, and supply chain optimization.
The example below illustrates the simple scenario and high-level view the influence diagram showcases in pricing strategy for a company launching a new product.
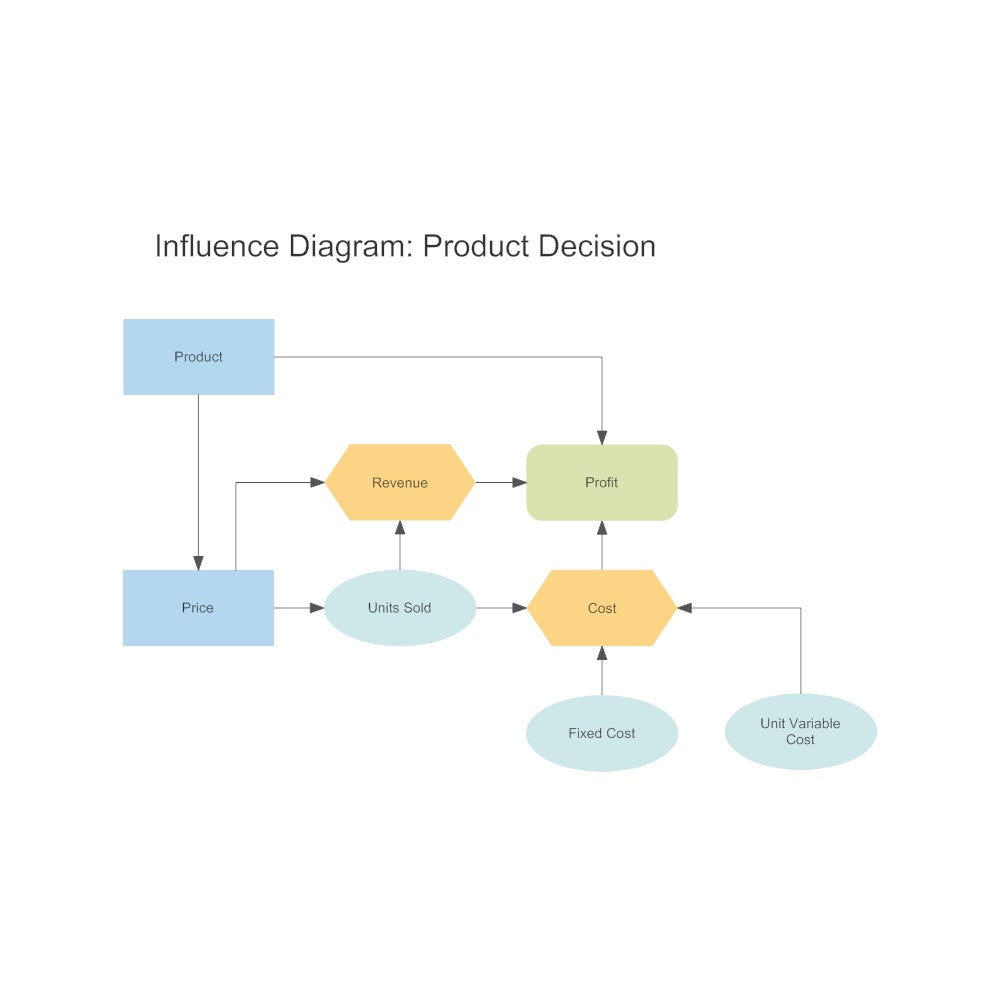
In this influence diagram, the company weighs market demand, competitor pricing, and their profit objective to make an informed pricing decision. It simplifies the complexity of pricing strategy and guides effective choices.
How to use the Influence Diagram
In just a few easy steps, you can create your own influence diagram.
- Begin with a decision or problem you want to analyze: This could be a yes or no question or a decision that needs a value, such as pricing. Enter your decision in the rectangle in the template.
- Identify key elements: Make a list of everything that could influence the decision.
- Assign nodes: There are four main types of nodes you’ll use:
- Decision node (rectangle): represents the choices you need to make (e.g., pricing)
- Chance node (oval): variables you may not know or be able to control (e.g., market demand)
- Objective node (hexagon): defines your ultimate goal (e.g., profit)
- Function (rounded rectangle): describes relationships (e.g., revenue models)
- Connect nodes: Draw directional arrows between nodes to represent paths of influence, dependence, or relevance. What the arrows represent depends on the type of node they point to.
- Evaluate impact: Consider how changes in one node affect others. Explore scenarios by adjusting variables to see other outcomes.
Bottom Line: Risk Identification Techniques and Methods
Risk identification is a critical step in project management. It involves identifying potential risks that could impact the success of a project. Some popular techniques and methods for risk identification, in addition to selective modeling, can include brainstorming or talking about risks, creating checklists for risk categories, reviewing existing documents, reports and historical data, investigating the underlying causes of incidents or problems, scrutinizing assumptions, creating a SWOT analysis, and consulting experts and SMEs for their insights.
Technology has made implementing these techniques even easier. Risk identification is an ongoing process. Continuously assess risks throughout your project to adapt and respond effectively and empower your project management.