


As a visual learner, I’ve always found Gantt charts to be one of the most powerful tools in my project management toolkit. They make it easy to see progress at a glance, manage deadlines, and map task relationships. While some may prefer dedicated Gantt chart software, others would rather skip it. That’s why I’ve put together a few Gantt chart templates for every project type so you can plug into your existing workflow.
Gantt chart templates by project type
Every industry has its own pace and project milestones. Here are some of the best free Gantt chart templates from top project management platforms, covering industries such as HR, marketing, construction, and web development.
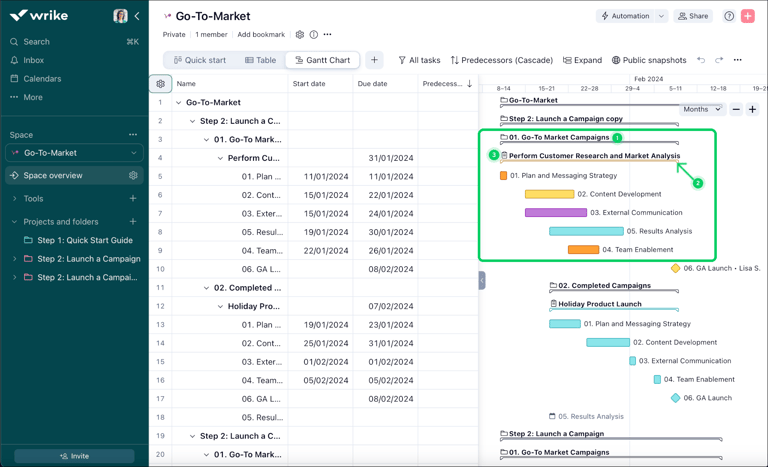
1. Business strategy Gantt chart template
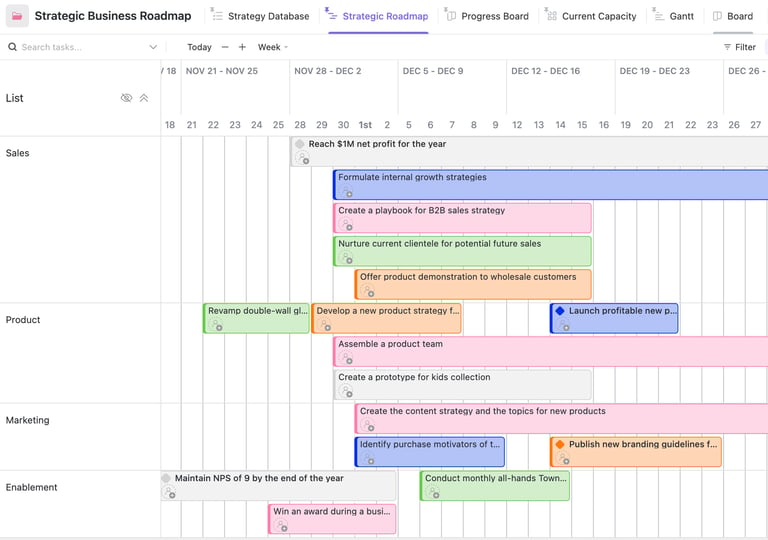
This ClickUp Gantt-style roadmap groups work by department, so you can quickly see how tasks across Sales, Product, Marketing, and Enablement overlap on the same timeline. The layout emphasizes high-level initiatives rather than tasks, while the color-coded bars let me identify ownership and timing.
What stands out is how well it supports project planning, since I can easily spot conflicts in scheduling and workloads. Although dependencies are not explicitly mapped, the placement of each bar still gives me enough context to understand how work progresses across teams. Use this view during quarterly or monthly planning sessions to decide when each team should start or pause initiatives based on timing overlaps and team capacity.
2. Event planning Gantt chart template
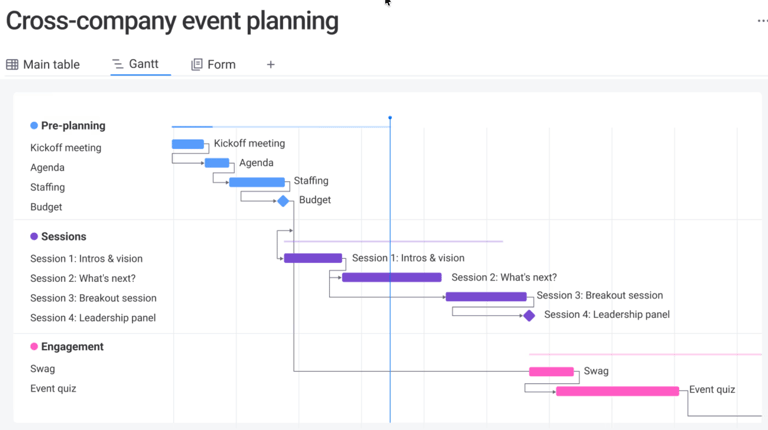
This Gantt chart from monday.com lets you organize event planning into phases like pre-planning, sessions, and engagement. You can see how preliminary tasks, such as budgeting and staffing, affect later activities, such as session delivery. The layout pairs a task list with a timeline, and the dependencies show how delays in one task can affect the rest of the schedule.
The main highlight of this chart is the line connections for each color-coded session, which make it easier to confirm the correct sequence of activities. You can use this view to confirm the right order of handoffs between teams and adjust timelines when preceding tasks move. However, since task ownership and resource allocation are not shown in this view, I would manage those details in a separate workspace or table.
3. HR training Gantt chart template
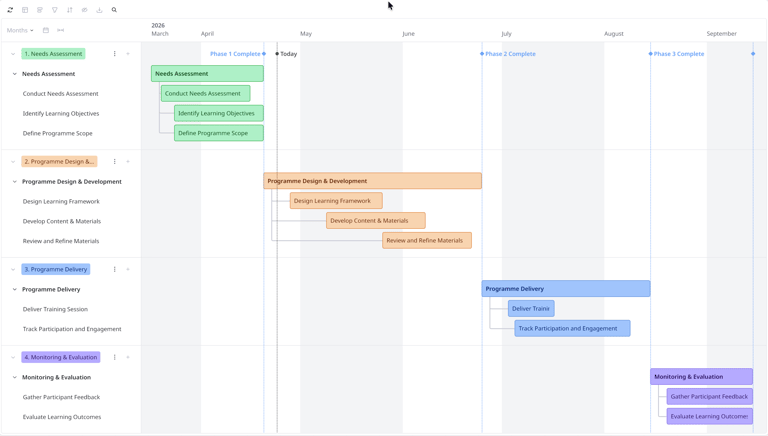
This Miro Gantt chart organizes an HR training program into phases such as needs assessment, design and development, delivery, and evaluation. On the left side, the nested tasks connect with the timeline, so you can see which activities take place within a phase.
The chart follows a fixed sequence because it does not use arrows or connectors to show task dependencies. Instead, it places tasks in order on the timeline, so you understand the flow based on when each task starts and ends. Milestone markers run along vertical lines, which verify whether each stage is progressing based on the schedule.
4. Website development Gantt chart template
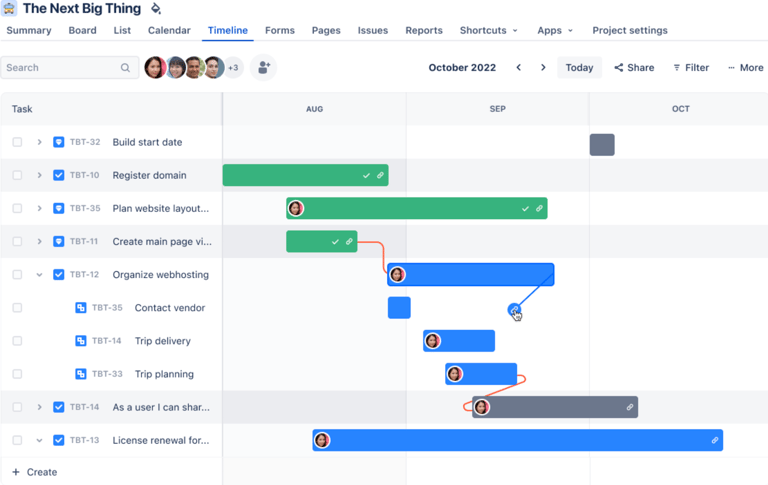
This Jira Gantt chart is ideal for tracking website development tasks such as domain registration, layout planning, and hosting. Like Miro, the task list is placed alongside the timeline, which helps in checking the scope or timing and how the current task affects the next one.
Each task bar includes the assignee, which saves time since there’s no need to open each task to check ownership. Since the structure assumes tasks are already broken down and assigned, I would rely on backlog or sprint views earlier in the process to define scope before using this Gantt chart.
5. Construction Gantt chart template
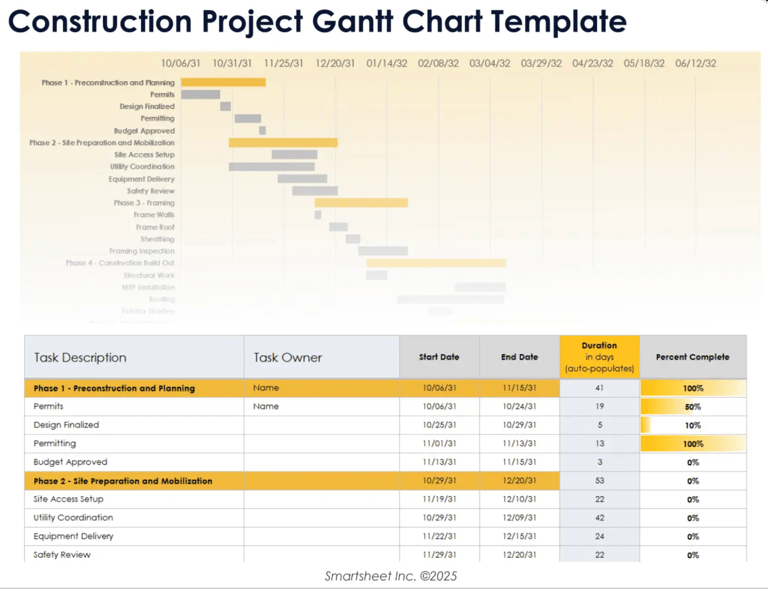
This Smartsheet Gantt chart template gives you a solid starting point for tracking a construction project at a high level. The layout separates the timeline and the task list, so you can scan the sequence of activities while using the table to double-check granular details such as start dates and task owners.
What I like about this template is the inclusion of auto-calculated duration and completion percentages, which allows you to track the exact status of each task. However, this chart doesn’t use dependency mapping and relies more on phase grouping. Overall, this template works best as a client-friendly schedule or an internal planning tool.
How to customize your Gantt chart template
With the right template in hand, the next step is tailoring it to your project. Here’s a simple guide to get you started.
- Set your project timeline. Add your start and end dates to define the project scope. This anchors every task that follows.
- List your tasks. Break the project down into individual tasks or deliverables, then group related ones into phases or workstreams.
- Set task durations. Assign a start and end date to each task based on how long it will realistically take.
- Add dependencies. Identify which tasks can’t begin until another is finished to reflect the true sequence of work.
- Assign ownership. Attach a name or team to each task to ensure accountability.
- Mark your milestones. Highlight checkpoints or deliverables that signal actual progress.
- Color-code your chart. Use color to distinguish teams, phases, or priority levels so the chart is easy to scan at a glance.
- Update it as the project evolves. Revisit your chart regularly to reflect any changes in scope, timeline, or ownership.
Key elements of a Gantt chart template
A standard Gantt chart consists of a few elements, such as a task list, milestones, dependencies, and phases. Each one serves a specific purpose, and understanding them helps you use one more effectively.
| Element | Description |
|---|---|
| Task list | A breakdown of all the work that needs to be done, listed along the left side of the chart. |
| Timeline | The horizontal axis that represents the project’s duration, typically divided by days, weeks, or months. |
| Bars | Horizontal bars that visually represent the start date, end date, and duration of each task. |
| Milestones | Markers that indicate checkpoints or deliverables throughout the project. |
| Dependencies | Connections between tasks that show which ones must be completed before others can begin. |
| Assignees | The team member or department responsible for completing each task. |
| Progress indicators | Visual cues, often a filled portion of the bar, that show how much of a task has been completed. |
| Phases or workstreams | Groupings that organize related tasks under a common stage or project area. |
Gantt chart template vs. Gantt chart software — Which one do you need?
A Gantt chart template is a great starting point because they are free and easy to set up in Excel or Google Sheets. However, when timelines or dependencies change, you have to update everything manually, which quickly becomes time-consuming.
Gantt chart software handles this more efficiently. If you are managing multi-phase projects or coordinating across teams, a dedicated tool updates timelines and dependencies for you, so you are not constantly maintaining the schedule.
Wrike is one option to consider if you need that level of detail and control. Its dynamic Gantt chart lets you adjust task bars on the timeline, link dependencies by dragging connectors, and turn tasks into milestones. When you move a task, any dependent work updates automatically, which saves time and keeps your schedule accurate without extra effort.
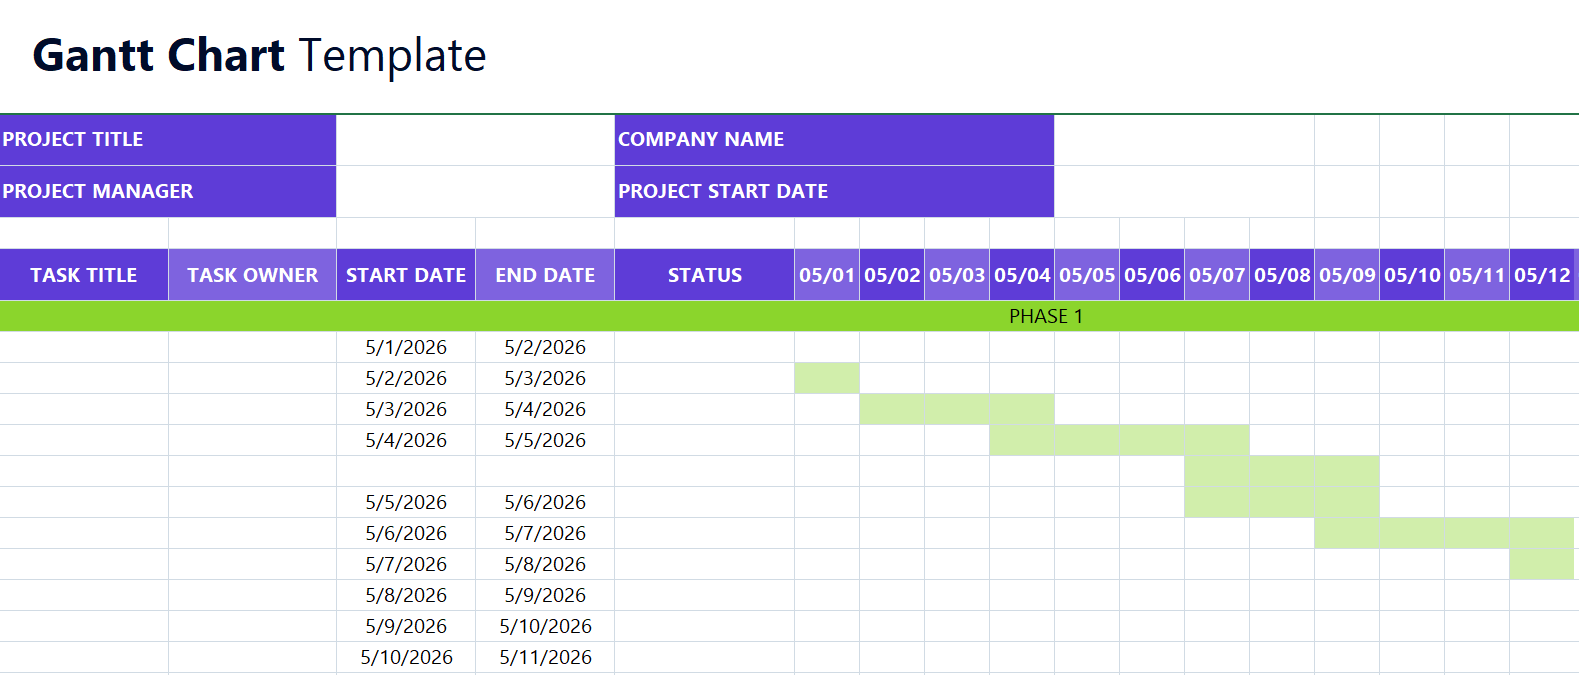
Free downloadable Gantt chart template
Here is a free Gantt chart template you can download for Excel or Google Sheets to map out your project timeline and get started right away.
FAQs
A Gantt chart template is a pre-built framework that helps you plan and track project tasks visually. It includes a task list, timeline, and horizontal bars representing task durations, so you can organize your project without building a Gantt chart from scratch.
Yes. Many project management tools now offer AI features that can generate a Gantt chart based on your project details. Tools like Wrike and monday.com let you set up tasks, dependencies, and timelines automatically.
A project timeline shows when tasks happen. A Gantt chart displays the same information but adds task durations, dependencies, assignees, and milestones. While a timeline is great for communicating a high-level schedule, a Gantt chart gives teams the detail they need to actively manage and track project progress.