SHARE
Facebook X Pinterest WhatsApp

5 Ways to Visually Manage your Projects

KEY TAKEAWAYS 5 Most Commonly Used Visual Project Management Tools There are many ways to visually represent your projects to make the communication better. Great visual representations help you compress enormous amount of information in a single sheet of paper. In this post, I will cover the top 5 visual representations in project management. Work…

Published: May 18, 2012
Updated: Feb 4, 2025
project-management.com content and product recommendations are editorially independent. We may make money when you click on links to our partners. Learn More

KEY TAKEAWAYS

  • Visual representations in project management help teams compress huge amount of information into one place, making it easy to track progress.
  • Some of the most common tools used to visualize data in project management include work breakdown structure, project network diagrams, Gantt charts, structure charts, and mind maps.

5 Most Commonly Used Visual Project Management Tools

There are many ways to visually represent your projects to make the communication better. Great visual representations help you compress enormous amount of information in a single sheet of paper. In this post, I will cover the top 5 visual representations in project management.

Work breakdown structure (WBS)

The work breakdown structure or WBS is a tree representation used to define the scope, costs and schedules at the start of the project. A node could be a project, data or a contract. WBS is helpful for identifying the deliverables in the projects and create a top-level summary of the project at the early stages.

There are a few rules of thumb in developing as Work Breakdown Structure:

  • 100% rule ‚Äì the WBS should capture 100% of the work and deliverables involved in the project.
  • No single deliverable should take more than 2 man-weeks (80 hours of effort).
  • Activities should be shorter than reporting cycle. For instance, if you have weekly meetings, you cannot have an activity longer than a week. You might need to break them down into smaller chunks.
  • When it makes no sense to subdivide a task, stop.

Example of a WBS chart

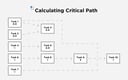
Project network diagram

This is a flowchart shows the dependencies and relationships between the different components of the project. It shows you what tasks can be done in parallel and what needs to be done sequential. Here the nodes are the different tasks and they are linked by arrows that show the sequence order. Learn how to create a project network diagram in Microsoft Office.

Gantt chart

Gantt chart is one of the fundamental tools for project planning and it is used to draw project schedules. Originally intended for 19th century steel mills, the tools has outlived its original use and finds applications in a broad range of industries. It represents the time taken for each activities identified in the WBS (Work Breakdown Structure).
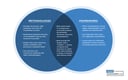
Structure chart

Structure charts is a visual project management tool that helps you break down a big system iteratively into small units that are represented in a tree structure. For instance, if you are developing a website – you could first break it down into the Database models, the front end part and the server side controllers, which could each be broken down into parts until you get to very manageable tasks.
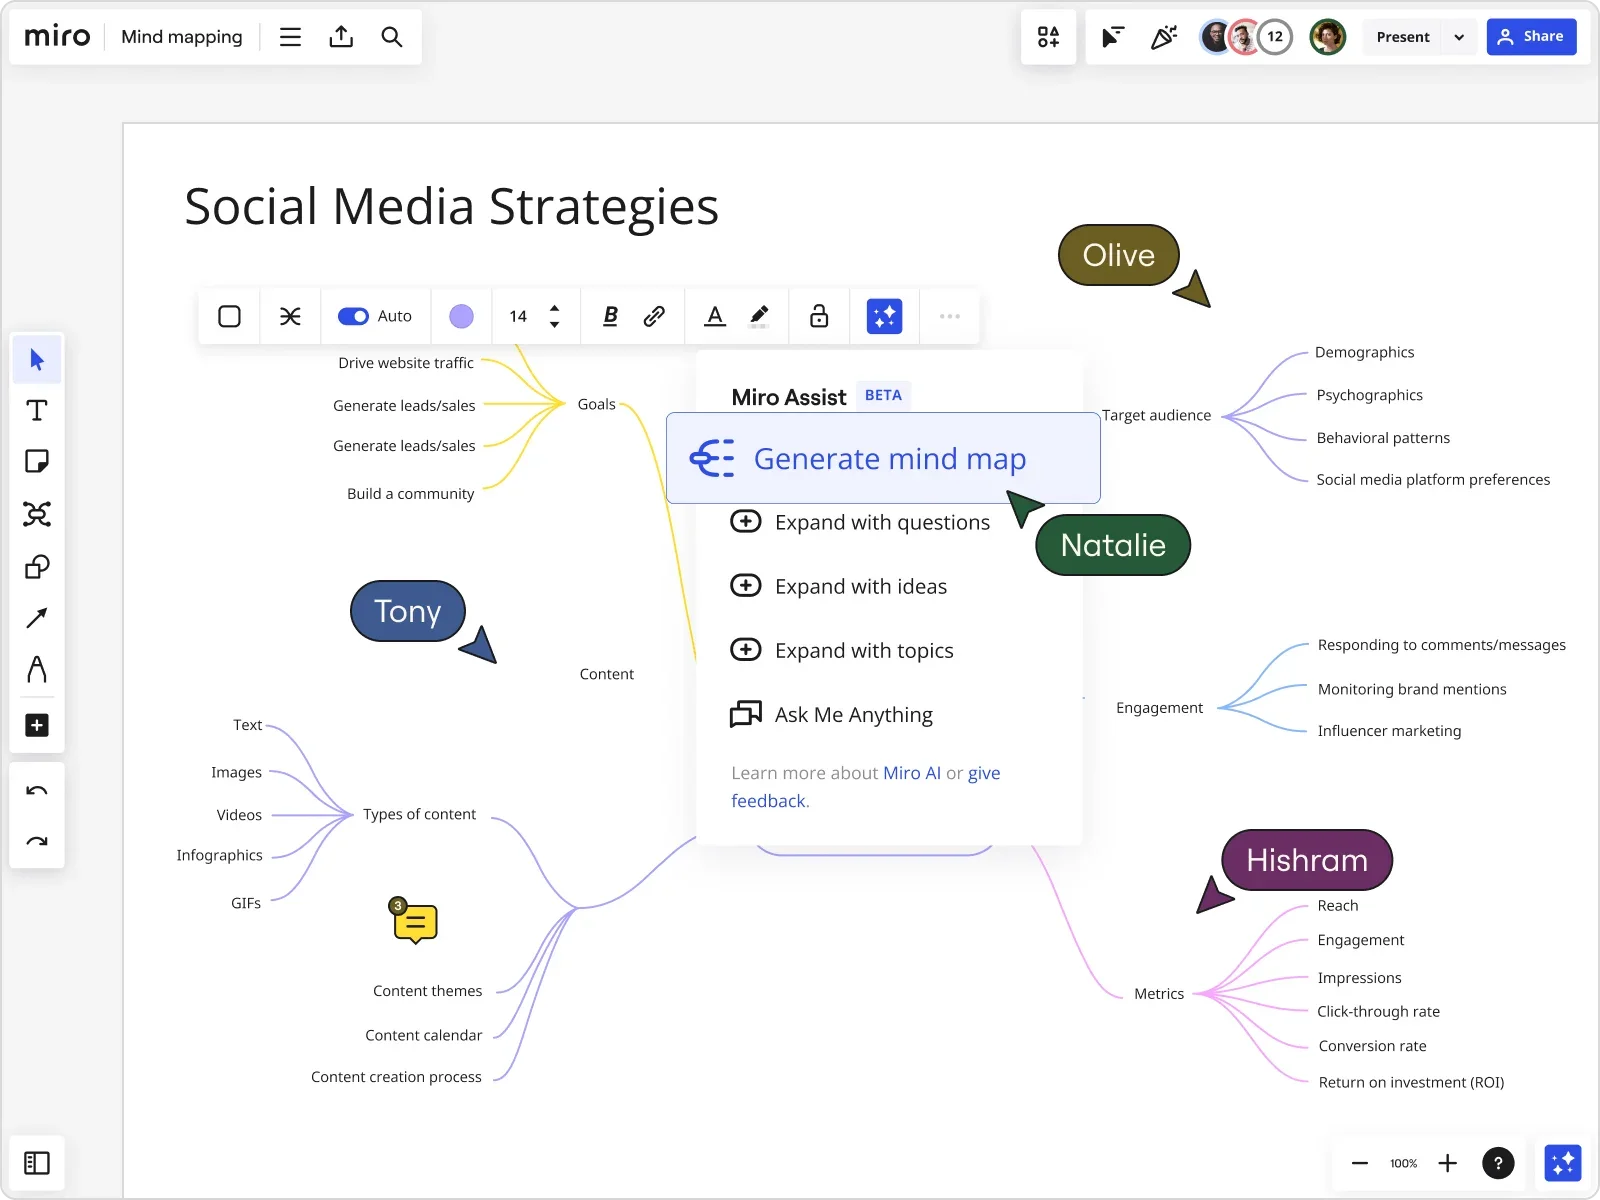
Mind map

Mind map is a visual representation of ideas and tasks that is used for brainstorming, note-taking and project management. Essentially, you start in the center of the page with an image or text and then draw other elements related to it as and when they are identified. Mind maps are more creative and crisp and can effectively convey the main contents in a single page. Mind-mapping software like Miro are packed with features designed for creating mind maps.

An example of a mind map created using mind-mapping software Miro
BV

Balaji Viswanathan is the founder of Agni Innovation Labs that helps startups and small businesses with their marketing and management strategy. He has been blogging for the past 8 years on technology, finance and business related topics.

Recommended for you...

Leadership in Project Management: Why It Is an Essential Skill
Technical Project Manager (TPM) vs Project Manager (PM)
Bradon Matthews
Oct 15, 2024
How AI Is Changing Project Management: Uses, Impacts, & Trends
Bradon Matthews
Sep 27, 2024
Elements of Risk Management: Everything You Need to Know
Matt Klein
Sep 9, 2024
project-management.com Logo

project-management.com is dedicated to providing modern tools, latest news, and best practice references for every project professional and business organization. The discipline of project management has continued to receive growing interest and attention over the past decades. Especially today, the importance and relevance of the project manager for any kind of undertaking is unquestionable. However, the challenges of modern society, business relationships and latest technology are also testing their competency and ability to deliver successful projects. Since its launch in 2001, PMcom has been featuring pertinent articles, management software and productivity tool reviews, books, interviews, training sites and other e-learning resources to help people be more productive and successful in their chosen path.

Property of TechnologyAdvice. © 2025 TechnologyAdvice. All Rights Reserved

Advertiser Disclosure: Some of the products that appear on this site are from companies from which TechnologyAdvice receives compensation. This compensation may impact how and where products appear on this site including, for example, the order in which they appear. TechnologyAdvice does not include all companies or all types of products available in the marketplace.