Planning and tracking your projects has never been easier. Check out our list of the top 5 project scheduling software and find the perfect option for your team.
Learn the basics of project management with this comprehensive guide. We'll cover everything from the planning process to daily project management tasks.
Start your project management career journey by knowing what the CAPM certification is and how it can help you in your career. Read our guide for details.
How to Create a Project Management Plan in 5 Steps
We've made an easy-to-follow guide to help you create a project management plan in X steps. Gain key insights & practical tips to ensure project success.
How AI Is Changing Project Management: Uses, Impacts, & Trends
learn how AI is transforming project management with planning, risk management, decision-making, & team collaboration tools Explore trends & case studies.
Best Reporting Software and Tools for Project Management
To help you navigate through the ever-changing options available this year, we have compiled a comprehensive buyer’s guide highlighting the five best reporting tools and software as reported today from multiple sources. From intuitive user interfaces to advanced analytics capabilities, these tools have been carefully selected to empower you in making informed decisions and driving success in your data-driven endeavors.
project-management.com content and product recommendations are
editorially independent. We may make money when you click on links
to our partners.
Learn More
To help you navigate through the ever-changing options available this year, we have compiled a comprehensive buyer’s guide highlighting the five best reporting tools and software as reported today from multiple sources. From intuitive user interfaces to advanced analytics capabilities, these tools have been carefully selected to empower you in making informed decisions and driving success in your data-driven endeavors.
Tableau – Best reporting software for embedded analytics
Featured Partners
We are able to offer our services for free because some vendors may pay us for web traffic or other sales opportunities. Our mission is to help technology buyers make better purchasing decisions, so we provide you with information for all vendors — even those that don't pay us.
In today’s rapidly evolving workplace, the need for accurate and powerful reporting tools and software is required to stay competitive. Whether you’re a business professional, data analyst or scientist, or researcher, finding the right reporting tool increases your ability to extract valuable insights from enormous data sets.
Best for Marketing and Sales Reporting
Visit HubSpot
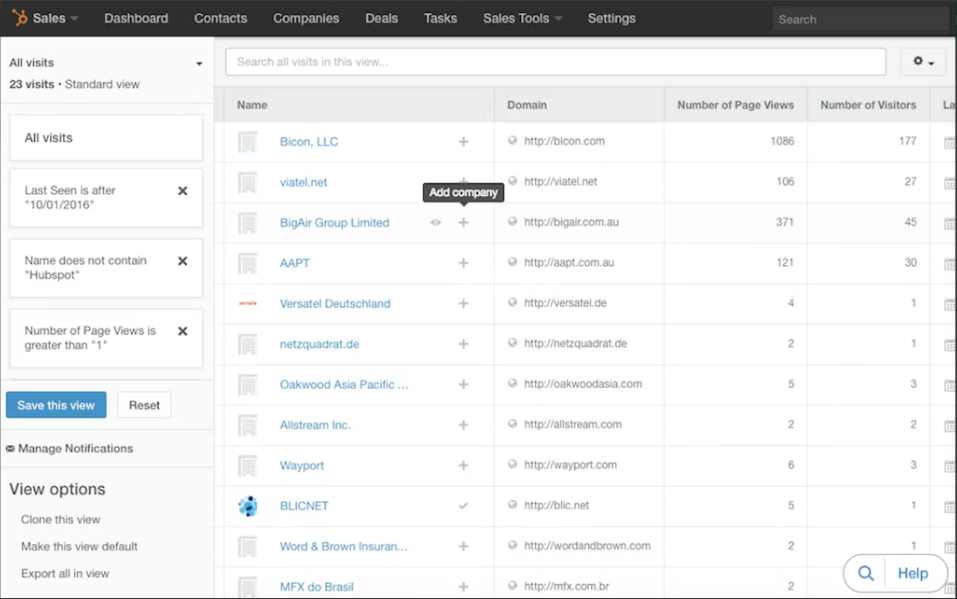
HubSpot is a platform that provides reporting features for sales, marketing, and productivity assessment. HubSpot Sales Hub has many reliable reporting features that include reporting dashboards, Sales Reports, Marketing Reports, Performance Assessment, Productivity Assessment, Deal Forecasting, Deals Closed vs. Goal, and a Recent Activity Feature.
Its sales reporting software gives you deep insights into your pipeline to help you accurately forecast performance and coach your team to hit or exceed their goals. With it, users can easily and quickly create customizable and visually detailed reports with deep sales analytics for real-time updates on pipeline, team performance, deal status changes, prospecting, and conversions.
Advertisement
HubSpot Sales Hub Report
HubSpot Sales Hub Key Features
HubSpot Sales Hub is packed with features to help sales teams manage their processes effectively and improve customer interactions.
Contact and Lead Management: Sales Hub provides essential CRM functionality in a centralized database to manage your contacts and leads. Sales teams have the ability to track interactions, store contact and lead information, forecast sales, and view a timeline of all contacts and engagements, experiencing better organization and personalized communication in their sales efforts.
Email Tracking and Templates: Sales Hub has email tracking capabilities that notify users when prospects open their emails or click on specific links. It also allows sales reps to turn their best sales emails into templates, allowing them to save time for personalizing mail and sharing communications scenarios with their team.
Deal Management and Pipeline Tracking: Sales Hub sales teams manage their deals and track progress through a visual pipeline, obtaining insights into deal progress and identifying potential roadblocks. Users can view deal stages, track activities, and set reminders for follow-ups so that all opportunities are well-managed, and sales processes are refined and streamlined.
Sales Analytics and Reporting: Sales Hub provides robust analytics and reporting features giving sales teams the ability to track everyone’s performance and progress against quotas. Reps can track key metrics such as deal velocity, revenue attribution, and sales productivity. The data-driven insights delivered by Sales Hub make for better decision-making and continuous sales process improvement.
Conversation Intelligence: Sales Hub has a built-in ability to record, transcribe, and analyze sales calls and meetings. Its AI spots opportunities for improvement, gives insight into how the team is performing, and identifies coaching opportunities.
Pros
Endless reports
Intuitive interface
Contact and lead management
Extensive marketplace and community
Integration with sales tools
Cons
Reliance on HubSpot ecosystem
Support response time
Limited customization
High price for full-featured version
May be overwhelming for new users
Why We Picked HubSpot Sales Hub for Reporting
HubSpot Sales Hub is worth considering as reporting software because it has robust features and capabilities related to business reporting processes. These cover the bases of comprehensive data management, advanced reporting tools, real-time analytics, customizable dashboards, automation, scalability, and integration with CRM.
HubSpot Sales Hub teams can generate meaningful reports that provide insights into their team’s performance, identify areas for improvement, and drive sales success. A user-friendly interface and powerful analytics engine, make this a top contender for organizations seeking a comprehensive reporting solution. Although it may be pricey for advanced plans, the free version is solid and can be upgraded as your business grows.
Positive user reviews detail that Sales Hub satisfies the need for getting two or more departments communicating and tracking sales activities together. The interface is far easier to understand than Salesforce, and the onboarding process and ease of use for all users, as well as the support from HubSpot, make it an easy decision.
Advertisement
Best for Collaboration on Project Reporting
Visit Wrike
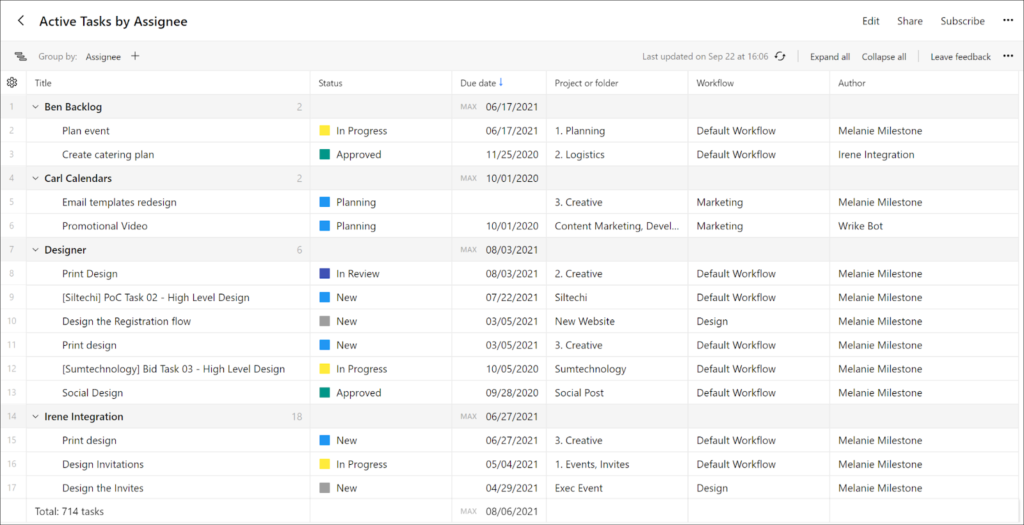
Wrike is a powerful project management software that offers a range of features specific to project reporting. Users can report on project information using Wrike Reports, which gives a high-level overview of how things are progressing.
Wrike’s project reporting tools benefit your business in a variety of ways, so you can streamline all your tasks on one platform. Check real-time progress and gain oversight on projects, tasks, and productivity. Select and use filters to fully customize what’s analyzed and schedule insights to arrive in your inbox automatically, or share reports with stakeholders to increase trust and accountability.
Wrike reporting dashboard
Wrike Key Features
Wrike’s powerful but simple project reporting software is full of reporting features to make any project run smoothly from beginning to end.
Customizable Reports: Wrike’s reports are significantly more customizable than the competition. With customizable fields, workflows, and dashboards, users can tailor Wrike to their specific needs and workflows, making it a truly flexible platform.
Real-Time Reporting: Wrike’s real-time reporting is superior to other platforms—it allows you to select filters to fully customize what’s analyzed, schedule automatic insights, and share reports with stakeholders to increase trust and accountability. Each time you open or refresh your report, it automatically updates to include the most up-to-date data that meets your report’s criteria.
Customizable Dashboards: Wrike’s personalized dashboards allow you to create custom widgets to track the metrics that matter most to your team.
Advertisement
Wrike Pros & Cons
Pros
Customizable reports and dashboards
Real-time reporting and data
Ability to share reports with stakeholders
Gain big picture visibility
Schedule automatic insights
Cons
Expensive for some teams
Delayed notifications for some integrations
Dependency on internet connectivity
Overly complex for simple projects or smaller teams
Why We Picked Wrike for Reporting
Wrike is a familiar and reliable project management tool that has added value for reporting. Wrike’s Work Intelligence® puts the power of data and AI to work for you, giving real-time predictions and suggesting changes for at-risk work. Whether your team is in the office, remote, or hybrid, this tool makes it possible to stay in sync with everyone and stay instantly informed of potential delays and risks.
Project managers and their team leads are constantly looking for tools to streamline workflows and to work most efficiently. The added bonus of detailed reporting makes this a comprehensive solution or stand-alone tool for teams looking for instant and valuable insight into their operations and behind-the-scenes details.
Best for Easy-to-Read Charts
Visit Zoho Analytics
Zoho Analytics is a reporting and business intelligence service that allows you to slice and dice your project data. It comes with a set of project reporting tools to give you actionable insights into your projects. You can assess how long a project will take to complete, find out who is free and who is occupied, and prioritize the order in which the tasks are to be carried out. With Zoho Analytics integration, you can now create and customize more than 50 reports to give you deep insights into your projects.
Zoho Analytics Sales Dashboard Example
Zoho Analytics Key Features
Zoho Analytics has an impressive list of features that users requiring data management and reporting should be aware of.
Data Integration: With Zoho Analytics, you can connect and consolidate data from over 250+ sources, including spreadsheets, databases, cloud storage, and other business applications. This feature gives users access to a comprehensive and unified dataset for project reporting.
Data Preparation and Management: Zoho Analytics stands out with its robust data preparation and management capabilities, offering intuitive tools and workflows that streamline data integration, cleansing, and transformation processes, ensuring accurate and reliable reporting results. You can use the self-service data and management application called Zoho DataPrep very easily with Zoho Analytics.
Visual Analysis: Zoho Analytics provides a wide range of charts, widgets, summary, pivot, and tabular views for creating insightful reports and dashboards. These advanced visual analysis capabilities output to interactive charts and graphics to arrange and present data in a compelling and easily digestible manner.
Augmented Analytics: Zoho Analytics goes beyond traditional reporting tools by leveraging AI-powered algorithms, machine learning techniques, and NLP technologies to uncover hidden insights, generate intelligent recommendations, and provide smart data alerts and forecasting.
Unified Business Insights: Zoho Analytics helps unify organizational data in a centralized platform with pre-built integrations across business applications and from multiple sources.
Pros
Robust data integration
Intuitive visual analysis
Advanced analytics capabilities
Automated reporting
Customization and white-labeling
Cons
Limited Natural Language Processing
Customer support can be laggy
Scarcity of documentation and assistance videos
Advertisement
Why We Picked Zoho Analytics for Reporting
Zoho Analytics is worth considering for reporting needs because it offers a business analytics platform that unifies organizational data with extensive data integrations across business applications. It also offers an intuitive drag & drop interface and flexible deployment options.
It is a high-scale, extensible platform that can handle large amounts of data and is a cost-effective solution for businesses looking to get started with analytics. It empowers users to generate insightful reports and make data-driven decisions. Research suggests that this tool excels in providing customizable and interactive dashboards, enabling users to explore data and present insights effectively. The platform’s AI-powered augmented analytics and collaboration features further enhance its value, enabling users to uncover hidden patterns, automate data exploration, and collaborate seamlessly.
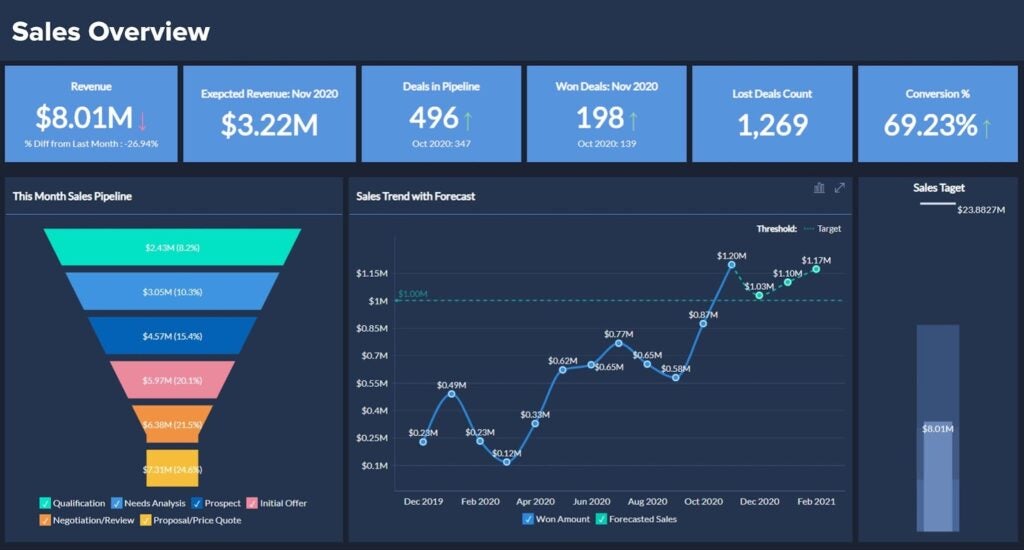
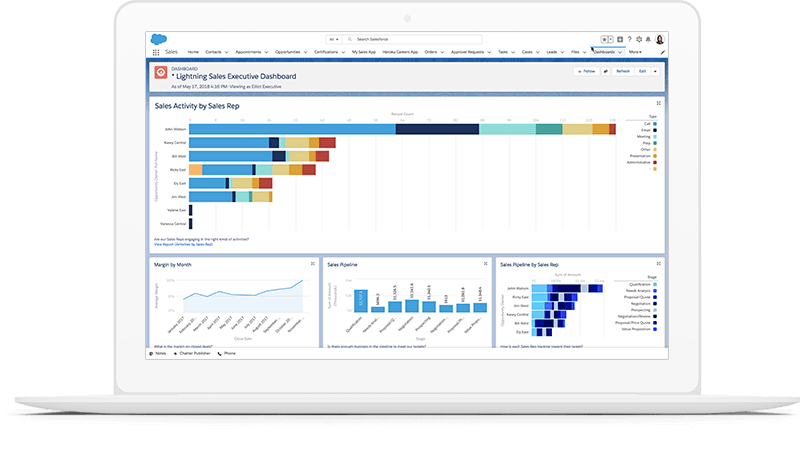
Salesforce Lightning is a software platform with a range of features for reporting, giving users valuable insights to make data-driven decisions. Some of the highlights of Salesforce Lightning include customizable dashboards, real-time data and AI-powered analytics, mobile access, collaboration and sharing, integration with the Salesforce ecosystem, and advanced reporting tools.
Lightning Sales Dashboard
Salesforce Lightning Key Features
Several stand-out features make Salesforce Lightning a popular choice for reporting.
Customizable and Interactive Dashboards: Salesforce Lightning fans can create custom-tailored dashboards for very specific reporting needs. The drag-and-drop interface and extensive range of components make it easy to build interactive dashboards for a dynamic and engaging reporting experience.
AI-powered Analytics with Einstein: Salesforce Lightning incorporates Einstein Analytics, an AI-powered analytics feature that brings advanced insights, predictive analytics, and recommendations to users. This capability sees users uncovering valuable insights, anticipating customer behavior, and making proactive data-driven choices, leveraging the power of artificial intelligence.
Mobile Accessibility: Salesforce Lightning is designed with mobile accessibility in mind. Users access and interact with reports on the go on smartphones or tablets. This feature provides flexibility and ensures that users can stay connected and make informed decisions, even when they are away from their desks.
Collaboration and Sharing: This feature has users collaborating on reports with their team and sharing them with stakeholders. Users can set access permissions, schedule report deliveries, and even embed reports in Salesforce records or external applications, enhancing this practice and data accessibility.
Integration with Salesforce Ecosystem: This tool seamlessly integrates with the broader Salesforce ecosystem, which includes various products and applications such as Sales Cloud, Service Cloud, and Marketing Cloud. It ensures smooth data flow so users can leverage data from different modules, experiencing a unified and comprehensive reporting workflow.
Pros
Streamlined and modern interface
Collaboration and sharing
Community support
AI-powered insights with Einstein AI
Scalability
Cons
Complexity and learning curve
Premium cost per user
Data storage limitations
Platform updates
Performance issues
Advertisement
Why We Picked Salesforce Lightning for reporting
Salesforce Lightning is worth considering for business reporting due to its robust set of features, user-friendly interface, and its position as a market leader in CRM solutions. Its customizable dashboards, advanced reporting tools, and real-time data updates empowers users to generate meaningful insights and make data-driven decisions.
The platform’s seamless integration with the broader Salesforce ecosystem, mobile accessibility, AI-powered analytics, and comprehensive collaboration capabilities further enhance its value. Research shows that Salesforce Lightning has been recognized for its scalability, reliability, and extensive support resources, making it a trusted choice for businesses of all sizes.
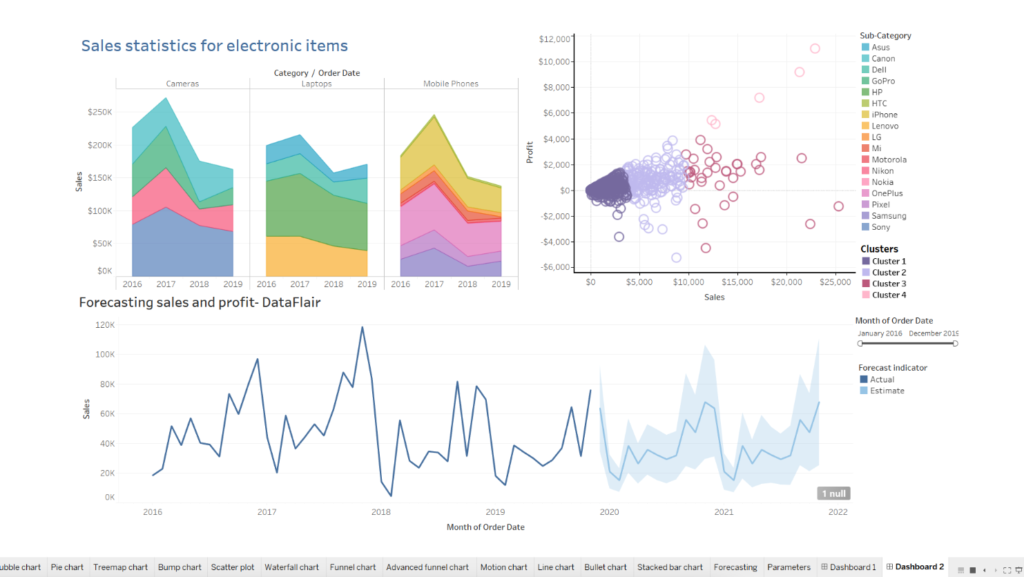
Tableau is a gold-standard reporting tool that is used for data analysis and is one of the fastest and most powerful tools used for visualization. Tableau reporting is a process of connecting to various data sources, extracting, analyzing, and visualizing the data in different forms like charts, graphs, and dashboards. It is used to identify trends, insights, patterns, and forecasts in the data to make business decisions. Tableau reporting is easy to use and does not require much technical knowledge.
Tableau dashboard example
Tableau Key Features
Interactive Data Visualization: Tableau’s interactive data visualization features can create dynamic and visually appealing reports. Its drag-and-drop interface, extensive library of visualization options, and interactive features like filtering and drill-down empower users to explore data in-depth and uncover insights, making it more user-friendly and versatile compared to other platforms.
Advanced Analytics and Calculations: Tableau goes beyond basic reporting by offering advanced analytics and calculations. Users can leverage a wide range of statistical functions, forecasting models, and complex calculations to perform in-depth analysis and gain deeper insights. This feature set distinguishes Tableau as a powerful reporting tool that enables users to uncover trends, patterns, and correlations within their data.
Seamless Data Integration: Tableau’s ability to seamlessly integrate with various data sources is a significant advantage. It supports connections to databases, spreadsheets, cloud services, and big data platforms, so users can consolidate data from multiple sources.
Real-time Data Updates: Tableau supports real-time data updates, so reports and dashboards reflect the most current information. Users can connect to live data sources or set up automatic refresh schedules to maintain up-to-date reporting.
Collaborative Environment: Tableau promotes a collaborative environment where users can share reports and collaborate on dashboards via a web-based platform and can publish and share reports across teams anytime, anywhere.
Pros
Powerful data visualization
Interactive visualizations and data maps
Advanced analytics and calculations
Handles large amounts of data
Intuitive drag-and-drop interface
Cons
Steep learning curve
Dependency on desktop software
Performance issues with large datasets
Inflexible pricing
Limited collaboration and version control
Advertisement
Why We Picked Tableau for Reporting
Tableau is an excellent reporting solution because it provides many features that make it easier to work with data. According to a recent study by Gartner, Tableau is one of the leaders in the business intelligence and analytics market. It is known for its ease of use, intuitive interface, and numerous data visualization options to help tell a story with data. Users can blend data from multiple sources and create more comprehensive reports. You can also collaborate with your team in real-time, share insights, and make decisions faster.
Research and user feedback consistently highlight Tableau’s strengths in data visualization, ease of use, speed and performance, data integration, advanced analytics, community support, and scalability. It stands out from its competitors due to its incredibly user-friendly drag-and-drop interface and wide range of features. Its visualizations are incredibly powerful and can be easily customized to fit the user’s needs. It is supported by a large community of users and developers who are constantly creating and sharing new visualizations and resources.
What Are the Key Features of Reporting Software?
When shopping for reporting software, there are several key features to consider.
Ease of Use: Reporting software should be easy to use and have an intuitive interface for users to work with data and create reports.
Data Visualization: Reporting software should provide a wide range of data visualization options that can help you tell your story with data in order to create reports that are engaging and easy to understand.
Data Blending: Reporting software should allow you to blend data from multiple sources and create a single view and more comprehensive reports.
Real-time Collaboration: Reporting software should allow you to collaborate with your team in real-time and share insights to work better together and make decisions faster.
Data Security and Governance: Reporting software should prioritize data security and provide robust governance features. This includes role-based access control, data encryption, audit logs, and compliance with industry regulations.
Advertisement
Benefits of Reporting Software
Reporting software provides several benefits to users. These include:
Improved Decision Making: Reporting software provides users with insights that can help them make better decisions. This is important because it can help businesses improve their performance and stay competitive. By presenting data in a clear and visual format, reporting software facilitates data-driven decision-making, leading to better outcomes and more accurate strategic planning.
Increased Efficiency: Reporting software can help users work more efficiently by automating tasks and reducing the time it takes to create reports. Reporting software automates the process of data analysis and report generation, saving users significant time and effort, while saving the business money. Instead of manually compiling and analyzing data, users can rely on reporting software to handle data aggregation, visualization, and generation of reports, freeing up time for more valuable tasks and increasing productivity.
Better Collaboration: Reporting software allows users to collaborate with their team in real-time and share insights. This is important because it can help teams work more efficiently and make decisions faster.
Data Visualization: Reporting software provides a wide range of data visualization options that can help users tell their story with data. This is important because it can help users create reports that are engaging and easy to understand.
Reporting Software FAQs
Reporting software should provide features such as data blending, real-time collaboration, and interactive dashboards. These features can help you work more efficiently and create more comprehensive reports.
You should look for software that provides a pricing model that fits your budget. The pricing model for reporting software can vary depending on the provider. Some software providers charge per user, while others charge based on the number of reports created.
Reporting software should provide a high level of support to users. This can include online tutorials, user forums, and customer support.
You should look for software that provides a high level of security to protect your data. This can include features such as data encryption and user authentication.
A good reporting software tool should provide a high level of customization to meet your specific needs. This can include features such as custom branding and custom report templates.
Advertisement
How to Choose the Best Reporting Solution
Choosing the best reporting software solution requires careful consideration of several factors. Here are some key considerations to keep in mind when making your decision:
1. Identify your specific reporting needs and goals. Before selecting a reporting software solution, clearly define your reporting requirements and objectives. Determine the types of reports you need, the level of customization required, and the data sources you want to integrate. This will help you narrow down your options and find a solution that aligns with your specific needs.
2. Evaluate the scalability and flexibility of the software. Consider the scalability of the reporting software to ensure it can accommodate your organization’s growth and evolving reporting needs. Look for a solution that can handle increasing data volumes, support additional users, and provide advanced analytics capabilities. Assess the flexibility of the software to ensure it can adapt to your changing reporting requirements over time.
3. Consider the software’s ease of use and user experience. Opt for reporting software that offers a user-friendly interface and intuitive features. Look for drag-and-drop functionality, customizable dashboards, and a visually appealing design. This will make it easier for users across your organization to adopt and utilize the software effectively, enhancing user satisfaction and productivity. If your company prioritizes ease of use, you should consider solutions such as Tableau.
4. Look into the data visualization options. Reporting software should provide a wide range of data visualization options that can help you tell your story with data. This makes it easier to create reports that are engaging and easy to understand. If your company prioritizes data visualization, you should consider solutions such as Tableau.
5. Determine the pricing scheme. The pricing model for reporting software can vary depending on the provider. Some providers charge per user, while others charge based on the number of reports created. If your company prioritizes cost-effectiveness, you should consider solutions such as Zoho Analytics.
Key Buying Considerations
If your company prioritizes real-time data visualization and collaboration, choose solutions that offer interactive dashboards with real-time updates and collaborative features such as commenting and sharing. Be cautious of software that lacks these features, as it may limit your ability to collaborate and make timely data-driven decisions.
If your company prioritizes real-time data visualization and collaboration, choose solutions that offer interactive dashboards with real-time updates and collaborative features such as commenting and sharing. Be cautious of software that lacks these features, as it may limit your ability to collaborate and make timely data-driven decisions.
Make sure to choose a solution that meets your company’s specific needs. For example, if your company needs real-time collaboration features, make sure to choose a solution that provides this feature.
Make sure to choose a solution that fits your budget. Some solutions can be expensive, so make sure to choose a solution that provides good value for money.
Finnaly, remember to thoroughly assess the software’s features, capabilities, and customer reviews to ensure it meets your specific requirements. Take advantage of free trials or demos to test the software’s functionality and determine its suitability for your organization. By considering these factors and making an informed decision, you can choose the best reporting software solution that aligns with your reporting needs and drives data-driven decision-making within your organization.
A versatile writer, Anne M. Carroll wears multiple hats in the literary and digital realms. As a contributing writer for Technology Advice and Project-Management.com, she shares insights on digital project management within highly regulated industries. Her expertise extends beyond writing—she’s a seasoned copywriter and a career digital project and program management consultant with a history spanning agencies and Fortune 500 organizations.
In many ways, the macOS is the ideal platform to support visual project management. Here, we’ve gathered the best project management software for Mac-based teams.
project-management.com is dedicated to providing modern tools, latest news, and best practice references for every project professional and business organization. The discipline of project management has continued to receive growing interest and attention over the past decades. Especially today, the importance and relevance of the project manager for any kind of undertaking is unquestionable. However, the challenges of modern society, business relationships and latest technology are also testing their competency and ability to deliver successful projects. Since its launch in 2001, PMcom has been featuring pertinent articles, management software and productivity tool reviews, books, interviews, training sites and other e-learning resources to help people be more productive and successful in their chosen path.
Advertiser Disclosure: Some of the products that appear on
this site are from companies from which TechnologyAdvice
receives compensation. This compensation may impact how and
where products appear on this site including, for example,
the order in which they appear. TechnologyAdvice does not
include all companies or all types of products available in
the marketplace.